

Donchian Breakout system
Richard Donchian was an Armenian-American commodities and futures trader, and pioneer in managed futures and systematic trading. He is the author of one of the first and most successful channel breakout systems.
Richard Donchian was the creator of the 4-week breakout rule. The system enters, long or short, on the 4-week high or low price breakout.
When we instruct the computer to draw horizontal lines from the 4-week (20-period) highs and lows a channel is created. The chart below shows a 20-bar Donchian channel on the EUR/USD 1-hour chart.
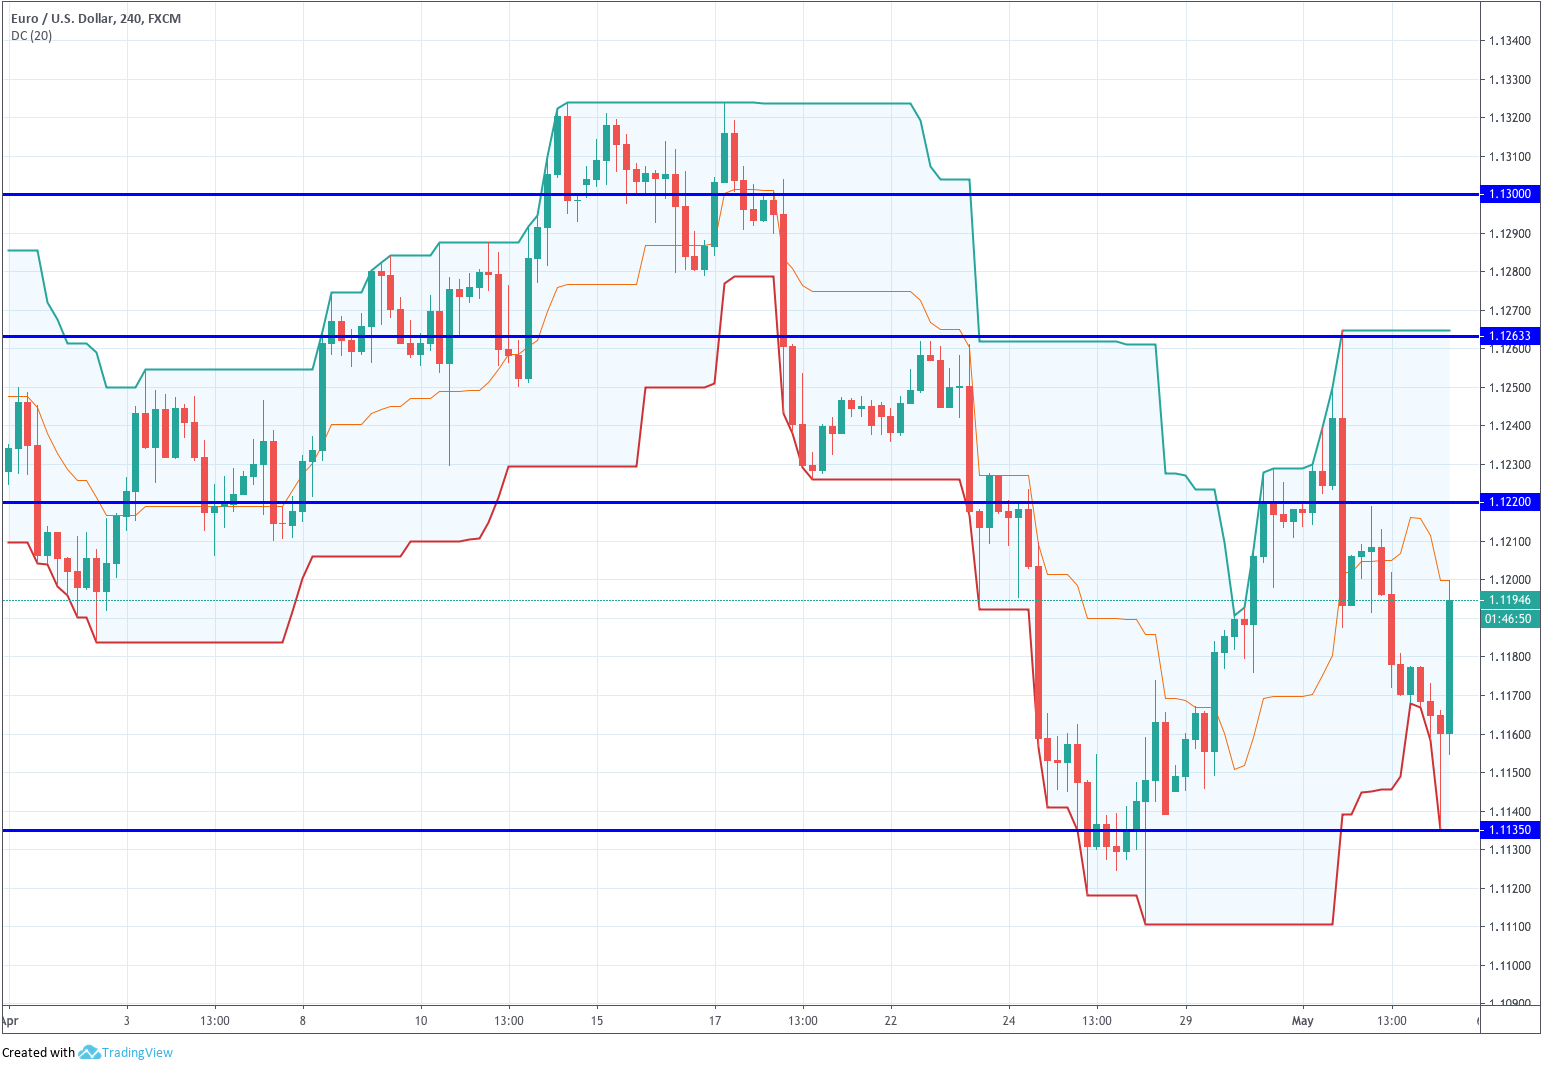
Chart 1 - 20-period Donchian channel on the EURUSD 4H Chart
When a new high is reached the upper band moves higher. Meanwhile, the lower band rests at the same level, until a new (higher) 20-day low comes out, building the stairway pattern we see in Chart 1. Sometimes, the upper band goes up while the lower goes down.
According to Perry Kaufman, Playboy’s Investment guide in 1971 published an article on the Donchian’s 4-week rule and describing it as a “childishly simple” way to invest.
The Donchian trading strategy:
- Go long (and cover short positions) when the current price is higher than the high of the latest 4 weeks
- Sell short (and close long positions) if the current price falls below the low of the latest 4 weeks.
The Donchian breakout is astonishingly simple and effective. Even today, after more than 50 years of it being public knowledge it is still profitable.
The system complies with three basic rules of trading:
Follow the trend
Let profits run
Limit losses
The third rule is somewhat achieved. In high volatility markets, where the highs are very far away from the lows, the risk problem cannot be solved trading the system as is. In the initial years using this system, they were focused in maximum returns, without regard to risk. Right now the usual approach is to accommodate the trade size to the volatility of the market.
Testing the N-BAR Rule
The extensive use of software trading platforms including some variety of programming language facilitates easy back-testing and optimisation of trading ideas. On this study, our objective was to test the N-bar Breakout in intraday trading.
We employed more than 12 years of minute historical intraday data on the EURUSD and USDJPY.
Fig 2, below, shows the N-bar breakout system parameter optimisation on 18 years of the EURUSD 1H chart. We used the Multicharts platform to do the test and obtain the images that follow. We see that there is a flat surface at the centre of the optimisation hill showing that the best behaviour is a 9-day breakout. We can see also that the flat surface is large. Therefore we can be sure that the parameter choice sound, and it is not the result of overfitting.
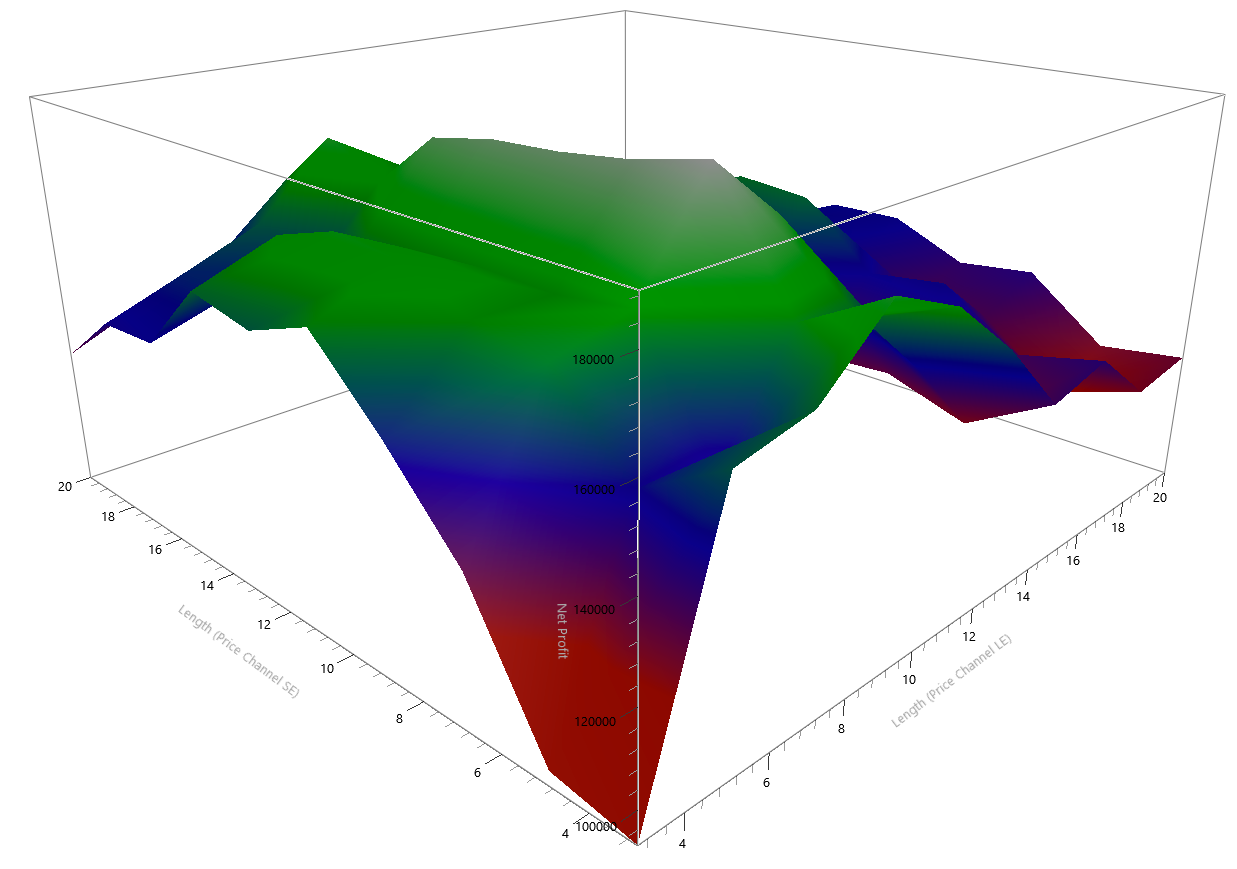
Fig 2 - The N-Rule Breakout Parameter optimisation
On figure 3 we can observe the EURUSD 12-year equity curve traded with a single contract (not pyramiding) using the 9-bar breakout rule.
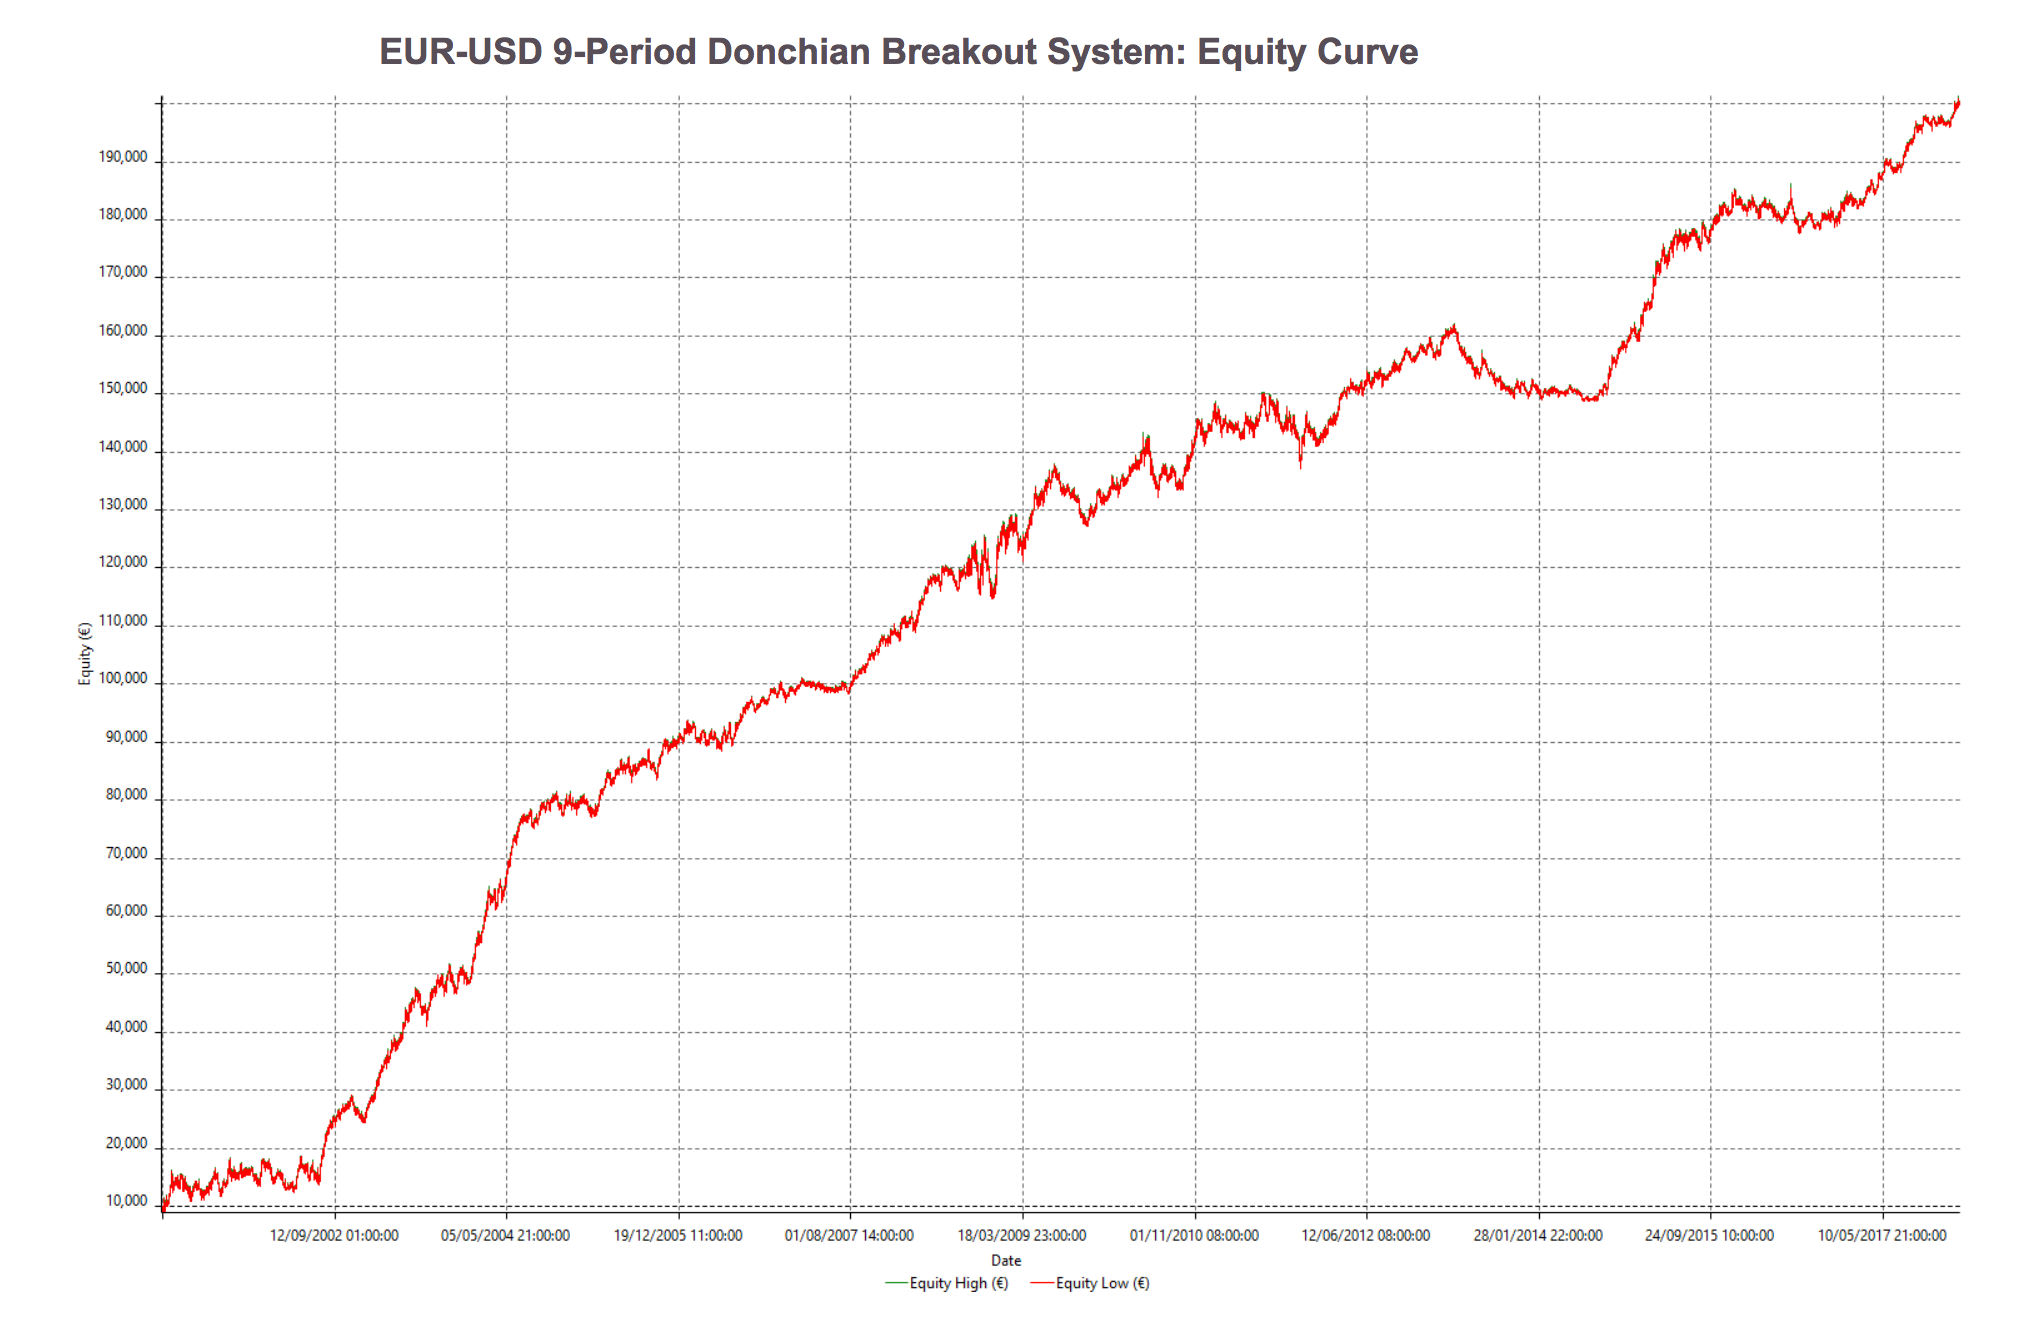
Fig 3 - 9-bar breakout on the EURUSD 1H equity curve
On the next table, figure 4 shows a summary of the system (click on it to enlarge the image:
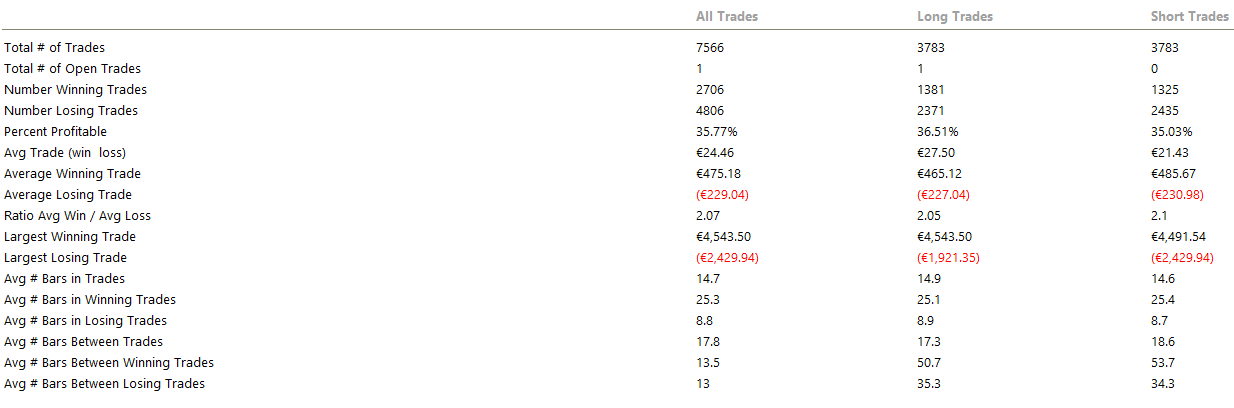
Fig 4 - Summary Trade Analysis for the 9-bar breakout on the EURUSD
On the table, we can see that the per cent profitable is 35.77% figure that is compensated by an average Win/loss ratio of 2.07.
Using the same system on the USDJPY pair we obtain a very similar equity curve.
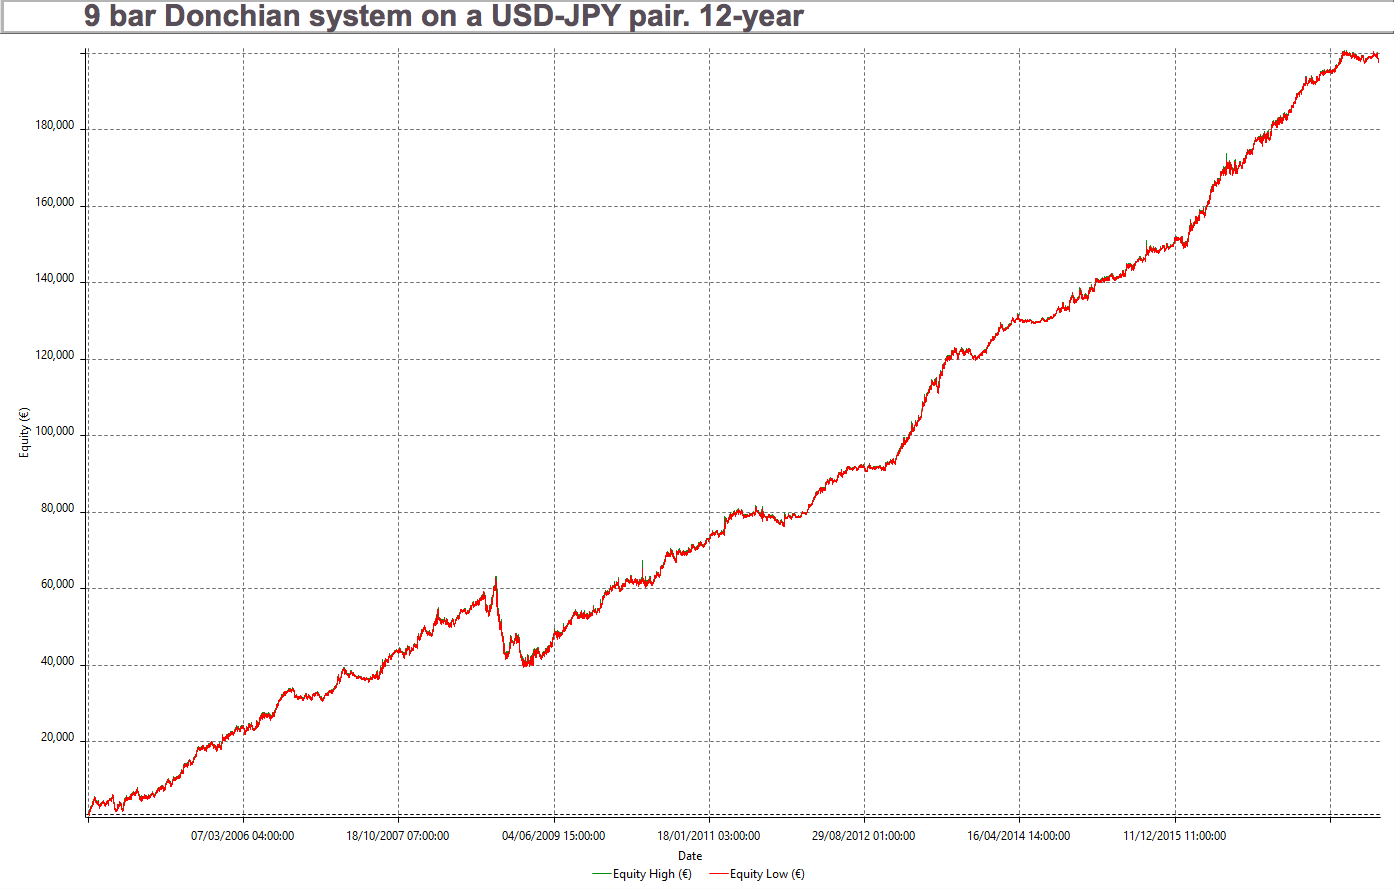
Fig 5 - 9-bar breakout on the USDJPY 1H equity curve
The summary analysis table for the 9-bar rule on the USDJPY is a bit better than on the EURUSD but very similar overall.
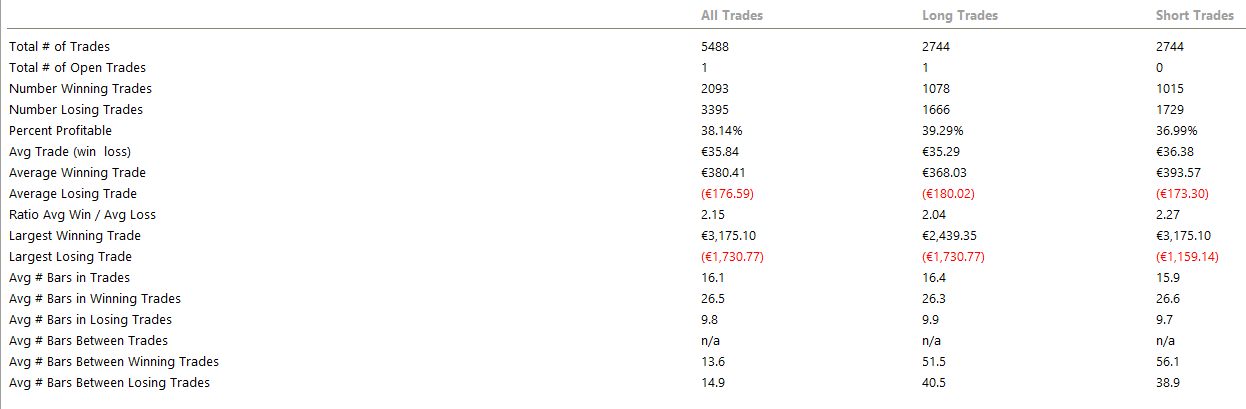
Fig 3 - 9-bar breakout on the USDJPY 1H equity curve
We can observe that this strategy has a bit more than 1 winner every 3 trades. That is not an easy system to follow. People want high per cent winners without looking anything else. Looking at this simple and rather unoptimised system (there is no targets nor stop-loss optimisation) we see evidence that for a system to be a winner long-term it does not need to be right most of the time. In fact, it is not right most of it. We see also that a good reward-to-risk ratio is key.
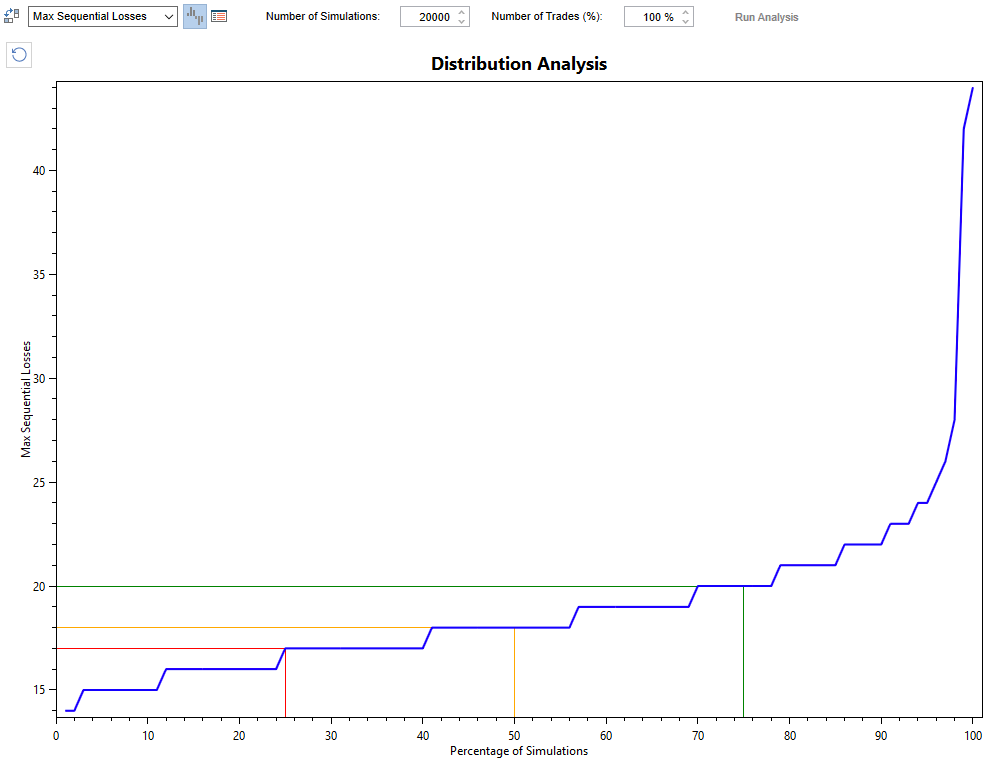
Drawdowns
All things considered, it’s important to look at the risk side of it. The downside of this system is that it bears large losing streaks.
A Monte Carlo simulation of the system tells that we need to be prepared to 20-25 losers in a row somewhere in the history of trades. Therefore we need to apply proper position sizes to account for this fact.
Diversification
To overcome long and deep drawdowns, the use of diversification is key: To trade a basket of uncorrelated markets with risk-adjusted position sizing, so no single market holds a significant portion of the total risk.
We will not go into details here, but suffice to say that if the portfolio is chosen in a way that uses correlation to balance losses on one asset with the gains on another, the overall risk can be reduced to more than 50% of the original risk for the same overall position size.
The Turtles
The Donchian 4-rule breakout is part of the history of systematic trading, and the subject of a fantastic story worth a Hollywood movie.
“We’re going to raise traders like they raise turtles in Singapore”, said Richard Dennis to his friend Will Eckhardt. They wanted to end a long debate about whether a trader should be borne or could be trained.
Richard Dennis believed that anyone with the proper education and coaching could become a successful trader, while Eckhardt thought a trader needed to be born with unique qualities. So, the Turtles were born!
The full story at the link, below:
https://www.huffingtonpost.com/zaheer-anwari/the-turtle-traders_b_1807500.html
