

Bollinger Bands
The most advanced variety of bands whose width changes with volatility was developed by John Bollinger, who called them Bollinger Bands. We have already discussed Keltner channels, which also adjusts its width using the average of the trading range. On this case, though, the width of the channel varies with the shifts in the standard deviation of prices for the period of choice. Statisticians know that on a data set that follows a Normal ( Gaussian) Distribution, 68.26% of prices fall within one standard deviation or Sigma. And 95.45% falls within two sigmas, while three sigmas contain 99.73% of all prices.
Prices do not strictly follow that distribution, long term, but in small scales, we can approximate price action to a Gaussian Distribution. Therefore, bands that map +1, +2 and + 3 sigmas are excellent signs of the extension of prices.
John Bollinger established 20 bars as the standard period to compute the Standard Deviation (STD) of prices. Also, 2-STD as the customary spread of the upper and lower bands from a central 20-period SMA.
He explains, that this arrangement would contain 95% of the price action, and says that using a 20-bar period the bands would be very responsive since the standard deviation calculation is computed using the squares of the deviations from the average. Therefore, the channel contracts and expands rapidly with volatility changes.
People work using Bollinger bands together with another technical study. Some traders use RSI. I believe, though, there are much better suited technical studies as companions for the Bollinger Bands, such as MACD and Stochastics.
I was introduced to Moving Regression lines together with Bollinger Bands by Ken Long, professor and military strategist, on a seminar that took place in Raleigh, NC, back in 2013 in the Van K. Tharp Institute. Ken calls his system the Regression Line Crossover (RLCO) and uses 30-period Bollinger Bands at ±1 and ±2 STD in conjunction with a Moving Linear Regression Crossover with 10 and 30-bar moving linear curves.
Many charting packages don’t have a native moving linear regression study, though. So, he presented, too, a very close alternative to it: The 30-10-5 MACD study.
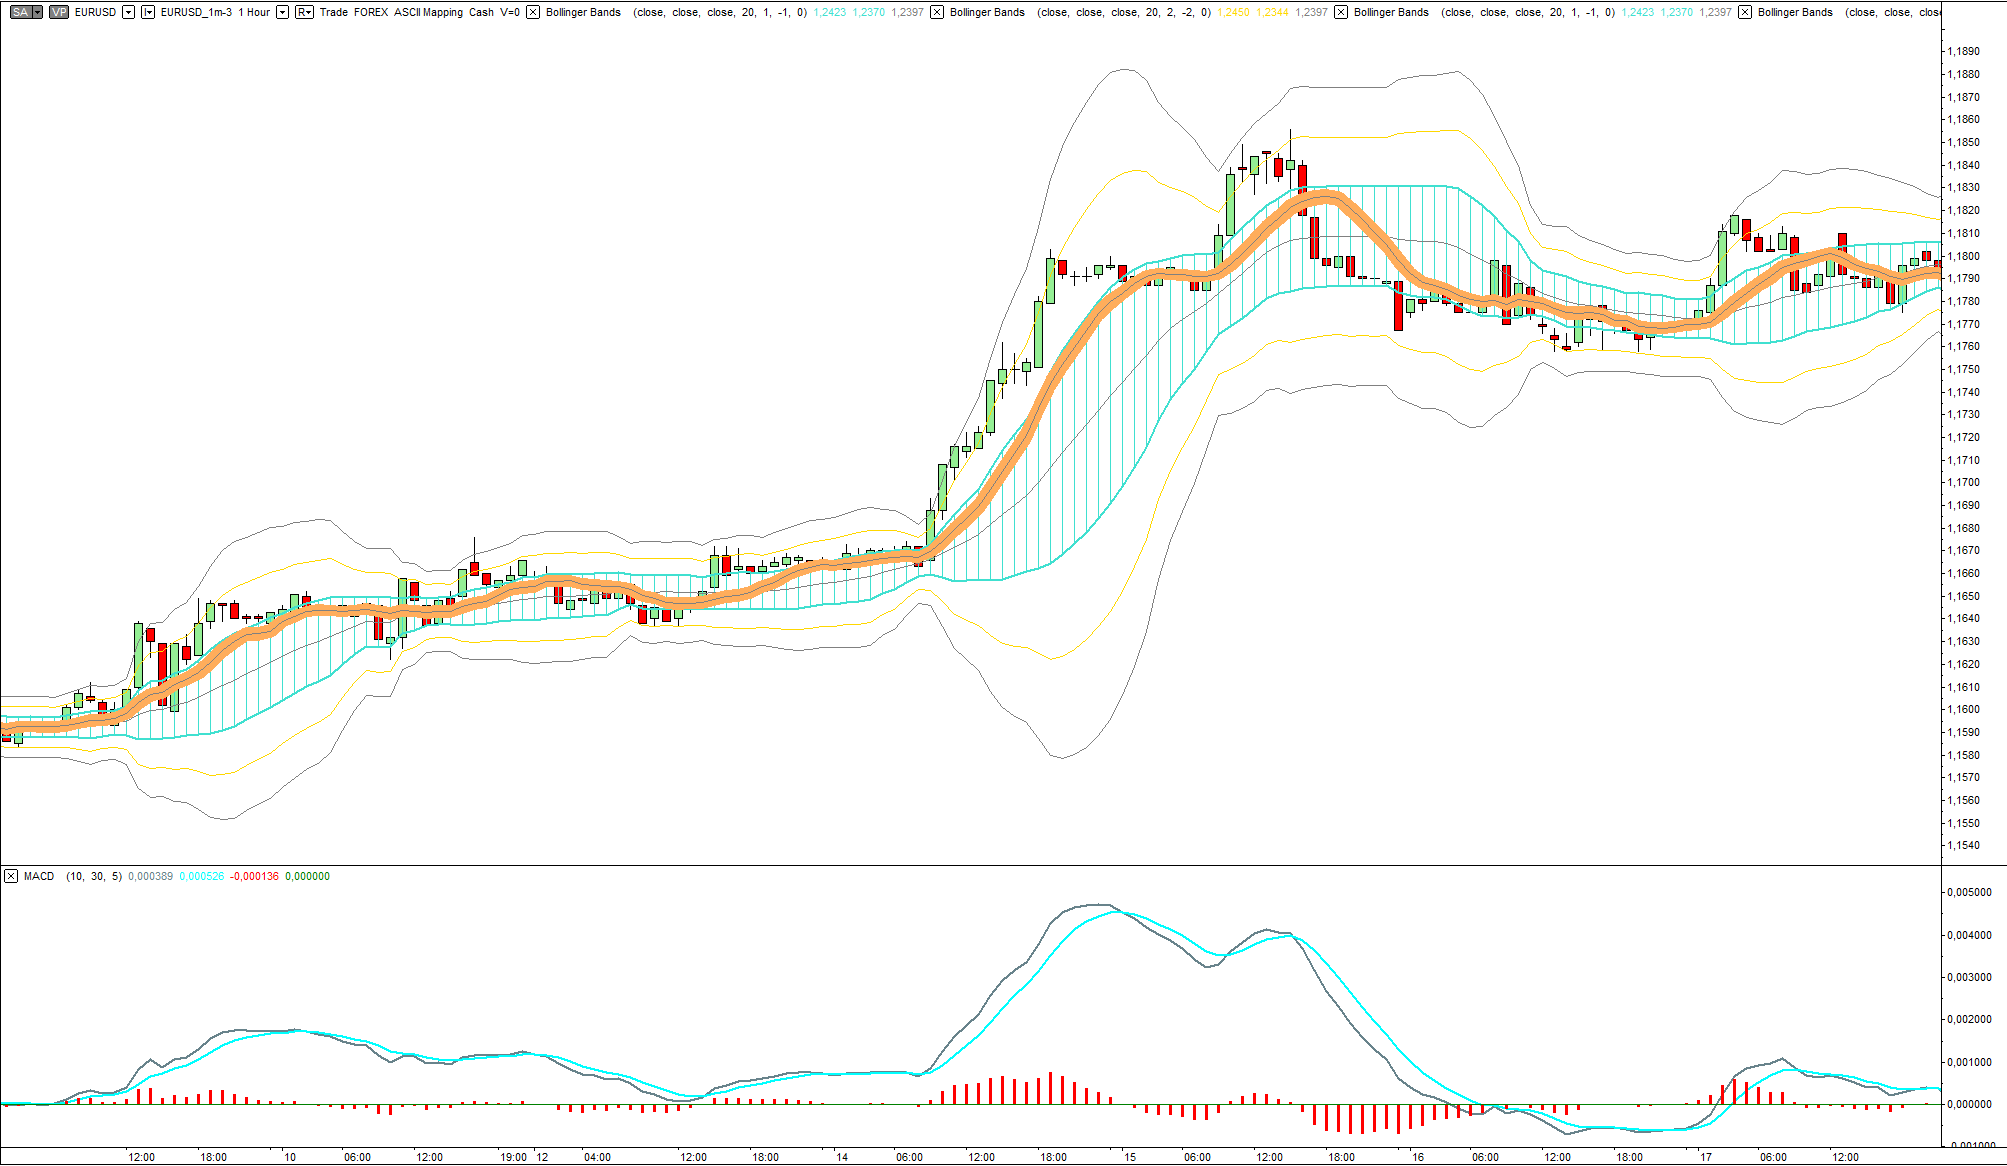
Chart 1 - EURUSD 1H 20-bar Bollinger bands at 1, 2 and 3 Sigmas from the mean. Including the dragon (10-bar,0.2STD BB) - Chart created using Multicharts(TM)
Bollinger Bands as a Price Map
As we said, the fact that Bollinger bands show symmetrical spreads away from its centre that marks standardised deviations of the price makes it suitable as a framework to quantify the deviation of the price away from its mean.
Ken Long described the ±1 bands as the river. The short-term evolution of prices is represented by the 10-period -0.2std width Bollinger band, which he calls the dragon due to its similarity to a Chinese dragon, so common in their festivities. Ken employs Bollinger Bands with a 30-bar period. However, I don’t find any good in its use. In fact, it makes it difficult to detect volatility contractions product of corrective sideways segments, because a 30-period BB is less responsive to volatility changes, so I keep recommending the standard 20-period.
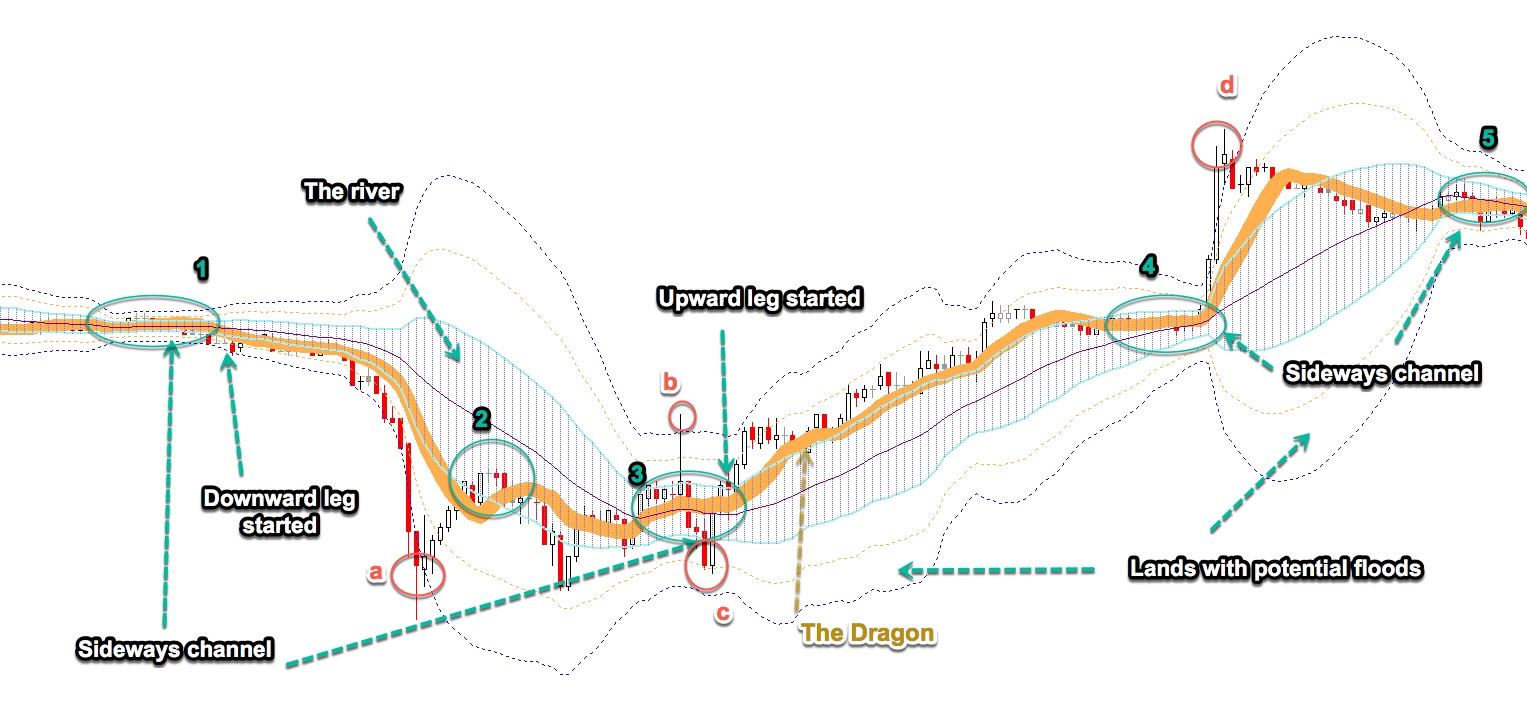
Chart 2 - The dissection of the Bollinger Bands
The “dragon” moves from one side of the river to the other, sometimes beyond. When it crosses the river and travels adjacent to the upper side, an uptrend has started. If it goes to the lower side and keeps moving near that side, a downward is developing.
As a fast visual clue:
- if the price is moving in the upper side of the +1 band the trend is bullish.
- If it moves below the -1 band the trend is bearish.
- Sideways price action is distinguished by volatility shrinking which reduces the channel width.
That sideways movement shrinks volatility is clearly visible, particularly in ±1 bands, as chart 2 shows (1, 3, 4, and 5). These locations anticipate great entry points when the price breaks out (4), or when the dragon starts moving next to one side of the river (1 and 3). You can earn your monthly payment by just trading this formation.
We must be prepared to close a failed breakout, as in b and c; and ready to reverse direction when the candle and dragon, cross the river because failure to continue is a clear indication to trade the other side. A trend can be identified, also by the expansion of the river and its “wetlands”.
If the price moves far away from the dragon and touches the 2nd and 3rd areas (observe points a and d), then the price is quite over-extended. Thus, surely it will retrace back to the mean of the river. This happens all the time. Not always this expected price action can be traded because when the trend is strong, the mean moves with the trend and the price action becomes horizontal, such as from d to 5. We should assess the reward-to-risk situation, and pull the trigger only if the reward outweighs its cost.
The two-spike pattern, at the limit of ±3 bands (a and d), is very significant, because it warns that the over-extension of the price has ended and a pullback will start right away. Therefore, we should take profits right away.
We already have noted that prices, after moving beyond bands ±2 and ±3, tend to move back in search for the mean. Usually, this pattern is a continuation of the main trend. The price travels to the proximity of the mean and resumes the trend, as in 2.
Using the Bollinger Bands Framework
Trading this specific Bollinger Bands framework aided by MACD crossovers is very insightful. When we use this framework, we know beforehand a lot about the actual situation of the market. At 1 we know we cannot trade long unless the dragon shifts sides. We, know, also, that the price stream is heading to the downside and the bands are expanding. All this information give us clues to the short side.
The action went as the signals hinted and finally, we witness the price collapsing at (a). The large shadow of the bearish candle has gone beyond the -3BB. Next, we see a white candle showing large wicks on both sides.
The close above the previous close confirms a pause in the downward movement. The price moves toward its mean value and, then, makes a higher low. At (3) we observe shrinkage of the volatility. (b) and (c) have fooled traders who took long and short trades respectively. But the large engulfing candle at (c), the movement of the dragon to the upper side of the river, and the expansion of the bands confirm that a new upward trend has started there.
Overbought and Oversold
The price action within this framework allows us to assess the status of the price action using statistical facts. We know that 98% of the prices are enclosed inside ±3 bands and 95% within the ±2 bands. This framework is a visualisation of the short-term overbought and oversold of prices.
Also, the risk-reward situation at a particular moment can be evaluated visually. If the risk of the trade is set 1STD below the entry and set the target is 2 STD’s away, based on its position in this framework, the trade shows a 2:1 Reward to risk ratio. There is no need to spend much time calculating. This is visual and fast. We can jump faster into any short-term trade situation!
A practical trade scalping-like exercise
Trading Bollinger bands with the help of the MACD is neat. Here the MACD signals the allowed trade direction and the Bollinger band identifies where the price is, relative to its mean.
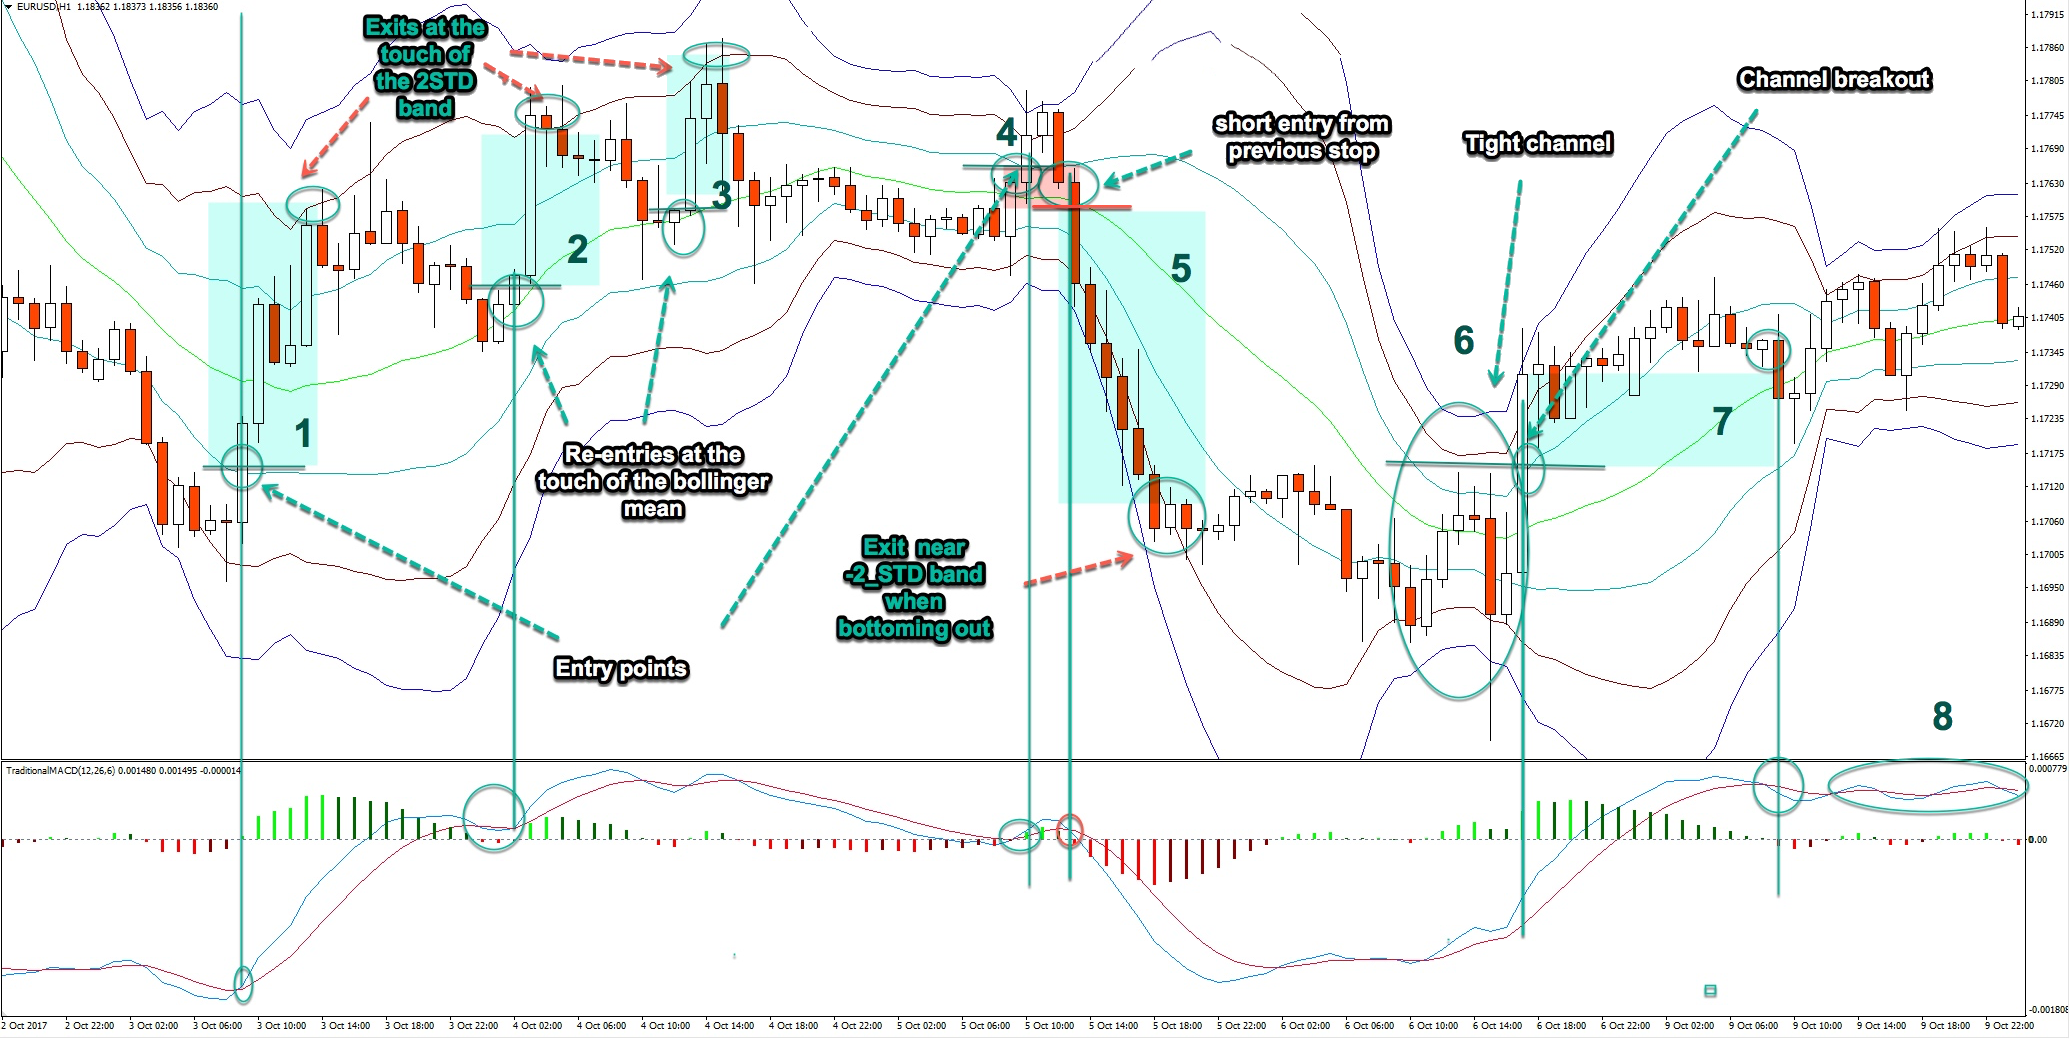 Chart 3 - Scalping using Bollinger Bands and the MACD
If we look at Chart 3, (1), we observe that, in the previous bars, the price has made a bottom, touching the -2 band four times. Also, a Doji has formed in the last one. Meanwhile, a MACD crossover signals a buy. It was a buy trigger at the breakout of the previous candles’ highs.
Fast and dirty profits can be set with a target at the +2 band for close to 3:1 reward to risk trade.
We have already noted that price when is moving in a trend, tends to go back to its mean after visiting outside bands, then, touch the mean and bounces off it. Therefore, at point 2 we’ll re-enter for a beautiful 2.5:1 Reward/risk trade. And this happened a second time at 3. We want to be quick and take no chance, so, let’s close the trade when the price touched the +2 band.
At 4 we see the sideways movement that is quite observable by a noticeable shrinkage of the three bands. This place should have been a good entry at the breakout, but the market fooled us for a small loss on the trade.
The MACD crossover and the downside breakout was the sign to stop and reverse (5). This time it didn’t fail for a big profit with almost 4:1 reward/risk. When it showed signs of bottoming it was the time to close the position, as seen in the graph.
At (6) we observe another sideways price action, so we can take its breakout once more. This time it didn’t fail, but the trend wasn’t strong enough to touch the +2 band, and when MACD crossed under (7) it was time to sell. We might have taken re-entries in that area, but the MACD wasn’t pretty, Overall, 5 winners and 1 small loser.
