

Bands formed by moving averages
As we already saw in our previous article, we can create different types of bands that can be used in trading. The simplest is the moving average envelope with bands X-percent away from the main moving average. Chart 1 shows a 10-bar EMA with 1,5% bands.
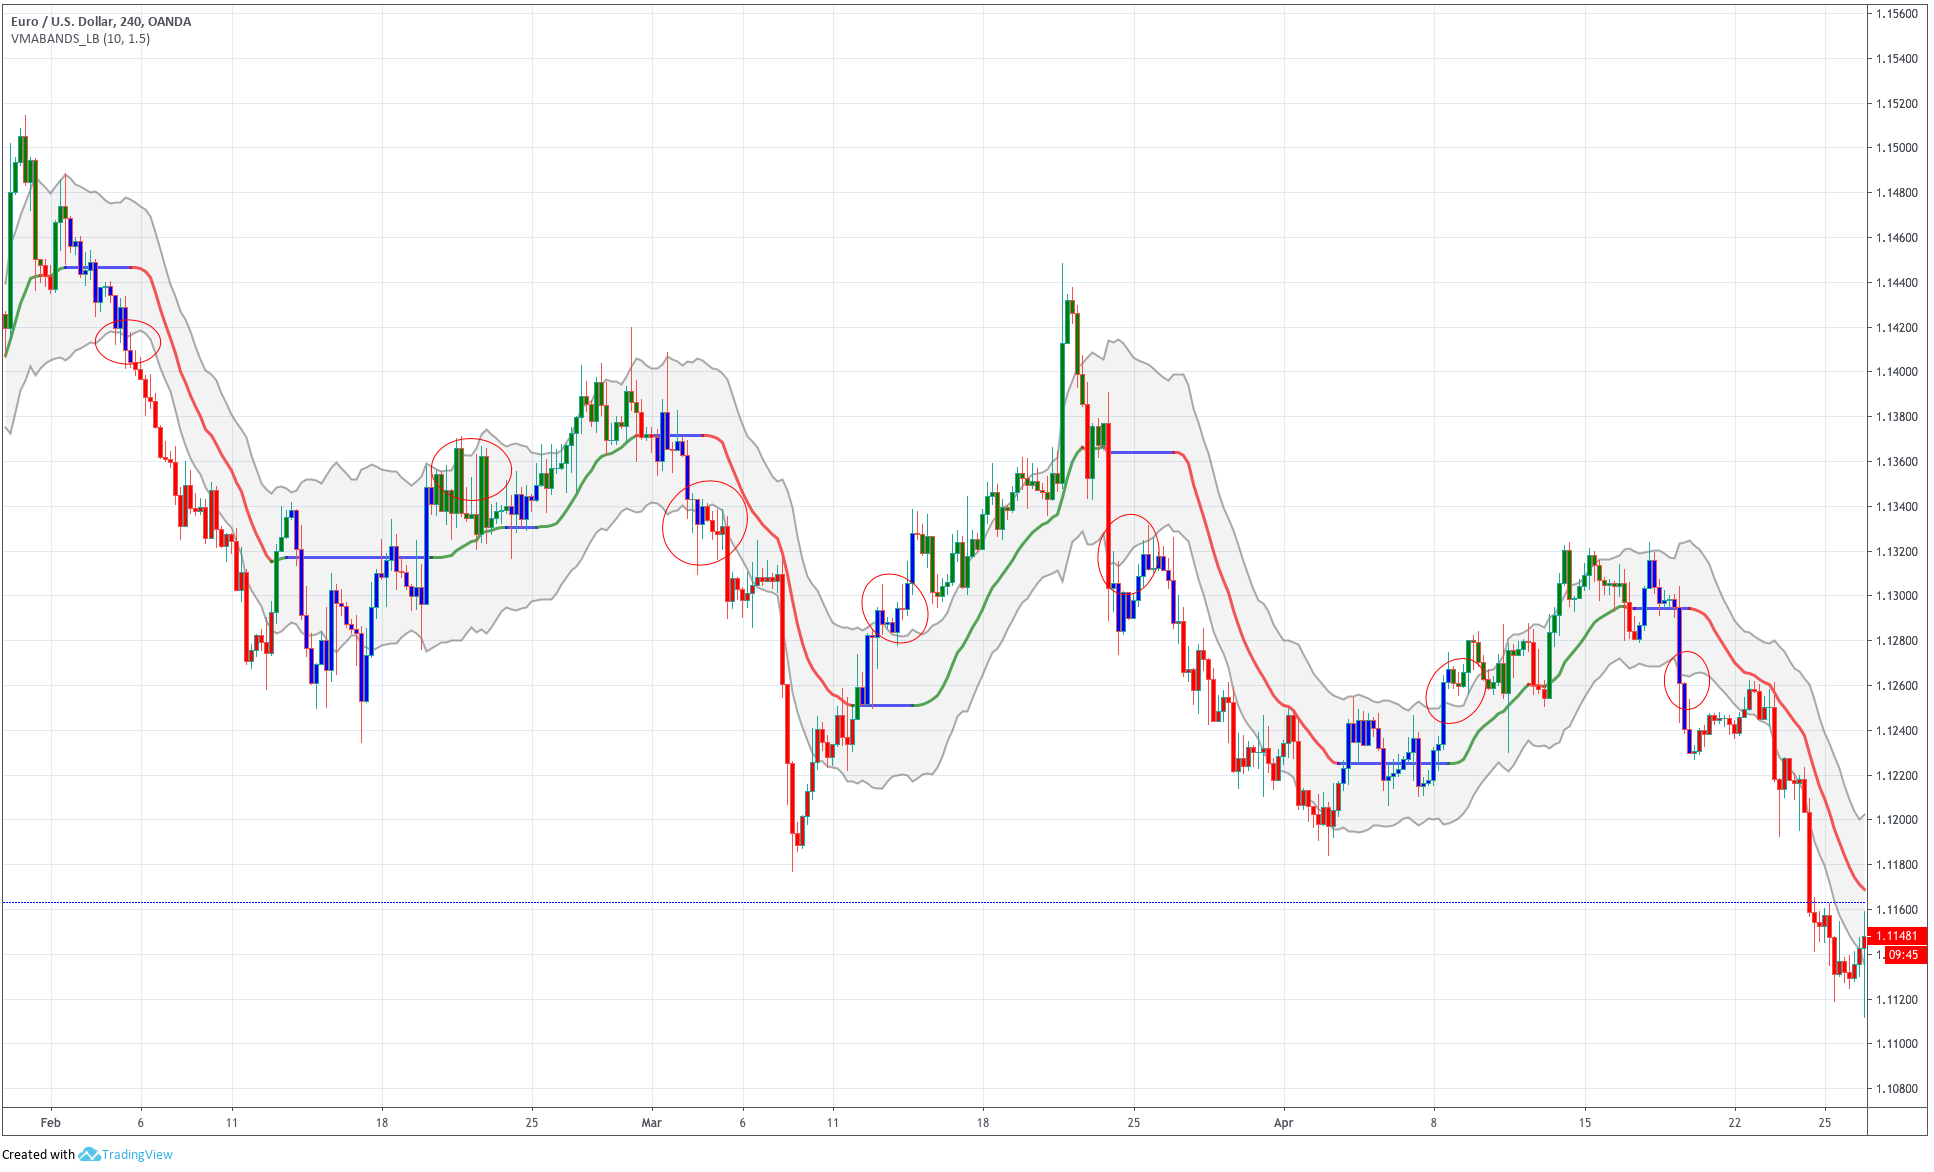
Chart 1 - 10-period, 1.5% moving Average Bands green and red colours to highlight the direction of the leg
Normally, the start of a leg is pointed out by prices reaching or surpassing one of the bands. That usually agrees with a new shift in the slope of the moving average.
 The bands here act as a kind of hysteresis for the price action. A safety zone where trades are forbidden.
We can do countless variations on this theme. We can change the period of the moving averages, make them simple, exponential or weighted, the distance of the bands moved wider or narrower. We, even, could favour the volatility in the direction of the trend by using asymmetric bands. For instance, in a bullish market, we could set the upper band to 0.5% and the lower one to 2%, so to hold on the pullbacks without our stops taken.
Envelopes on highs and lows
Since the breakout of highs and lows are very good trading methods, the idea of drawing a band using an average of the highs and one of the lows was not surprising, after all. The idea is the same: The early detection of a new price direction.
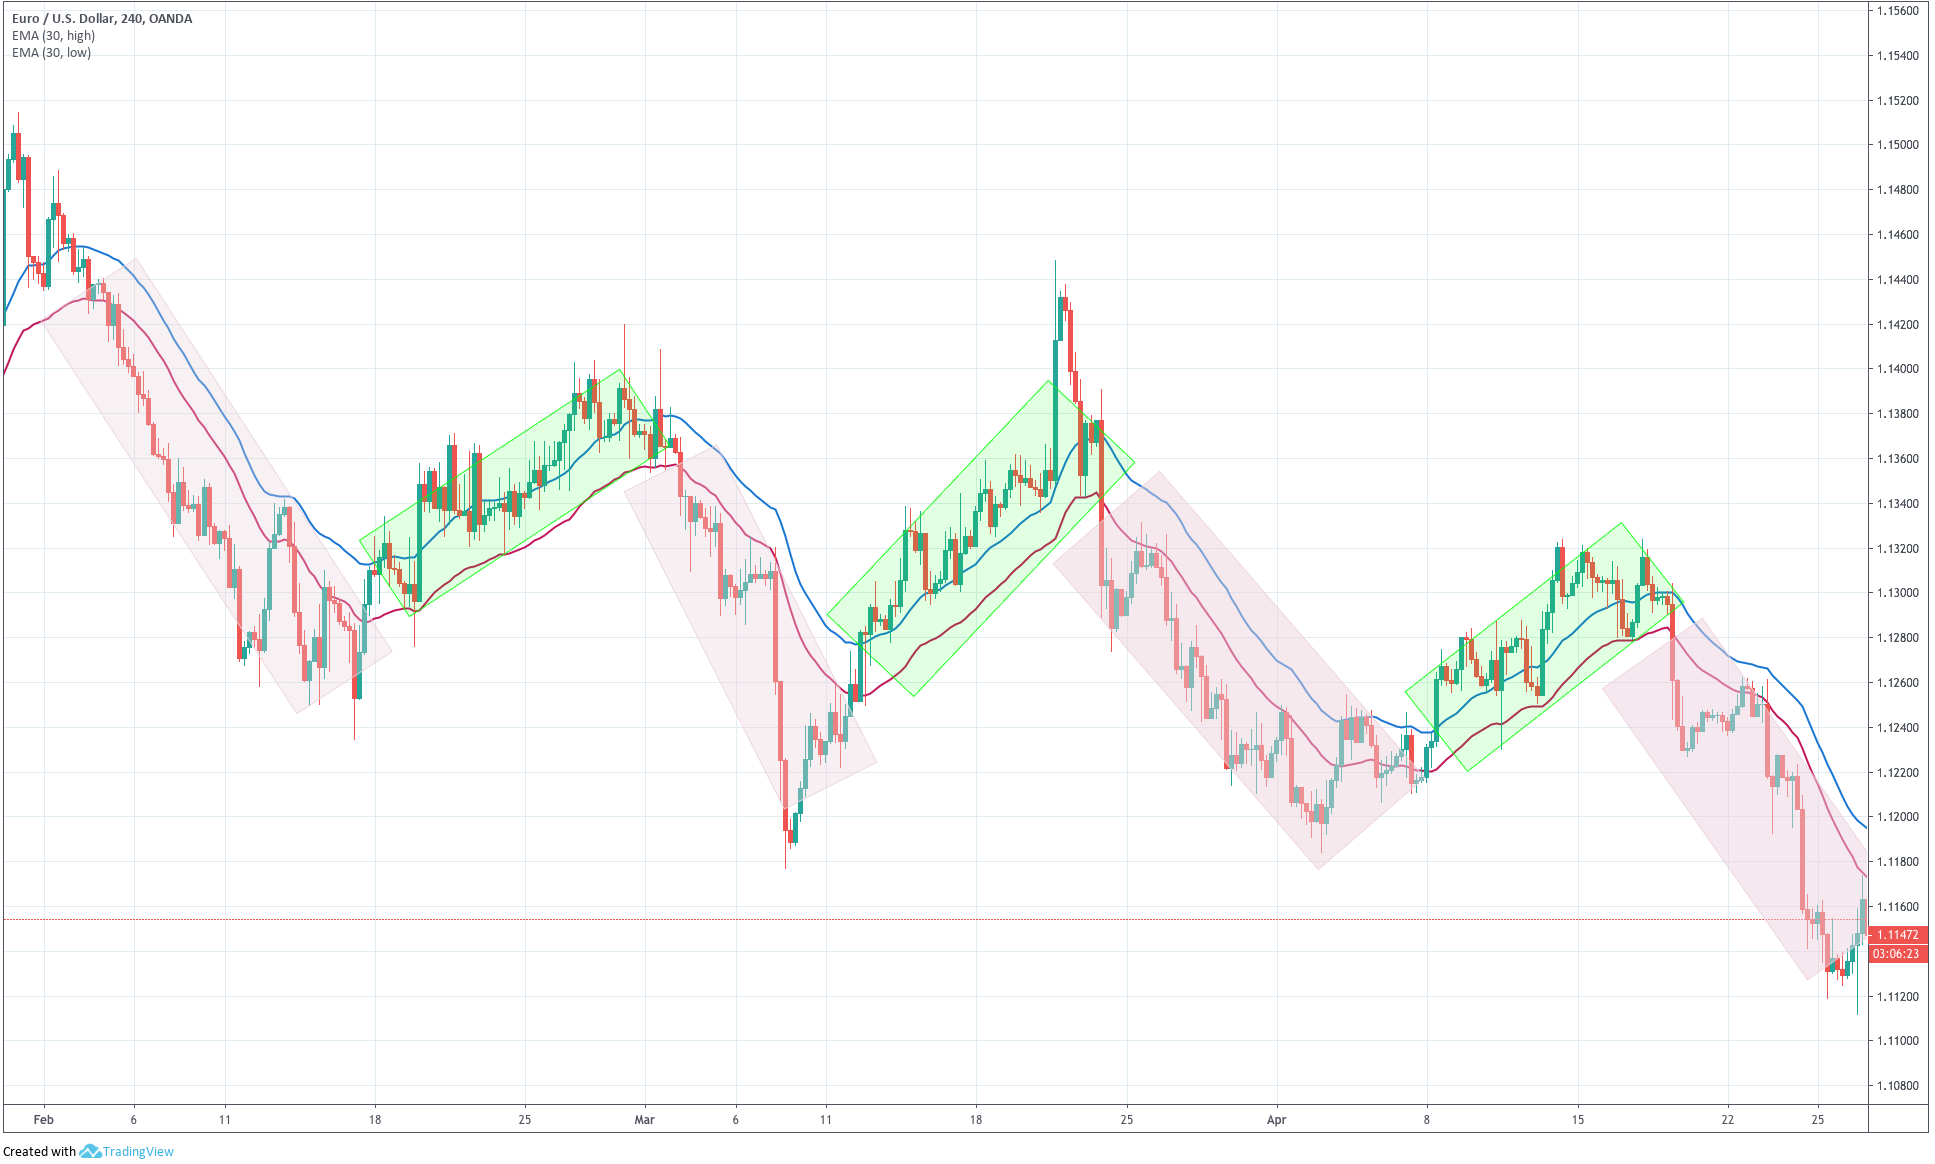
Chart 2 - Envelopes of highs and lows on the EURUSD 4H chart
A new upward trend is valid until the price does not close below the lower edge of the channel. The same holds true for a downward movement.
To examine if this entry method enhances the trading results over entries on a normal moving average breakout, Perry J. Kaufman did an analysis over a 10-year span, using both methods, in two rather different markets: Eurodollar interest rates and the S&P 500. His results are presented in table 1.
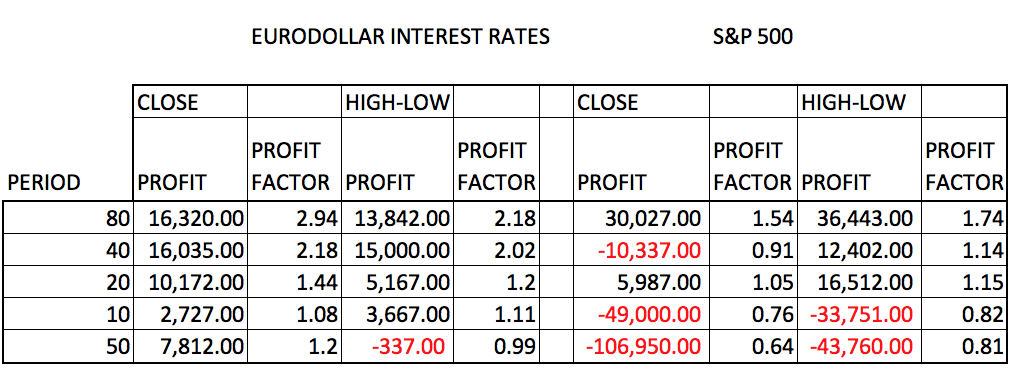
We can see that the HI-LOW bands are slightly inferior on the Eurodollar market, although the 40-period variant is quite similar. The opposite resulted in the S&P 500. Using a 40-period envelope Moving Average has turned a losing system on the S&P 500 into a winning one using periods over 20. Also, the 20-period variant has been greatly enhanced.
As a conclusion, bands can be a good entry method, but the trader needs to find out the right parameters for the market he tries to trade.
Keltner Channels
Chester Keltner was a very famous technical trader back in the 60ies. He described his 10-day moving average rule in his 1960 book How to Make Money in Commodities. This was a simple system that used a channel whose width was defined by the 10-day average of the trading range.
The rules to compute the lines delimiting the channel, as is done now is:
- define the Moving Average period n. Usually 20.
- define the average trading range period m. Usually 10.
- Set a multiplier q
- Compute the typical price: (high+low+close)/3
- Compute AR the n-period average of the typical price
- Compute MA the m-period average of the range
- Compute the upper and lower band lines by performing:
Upper line = qx AR + MA
Lower line = qx AR – MA
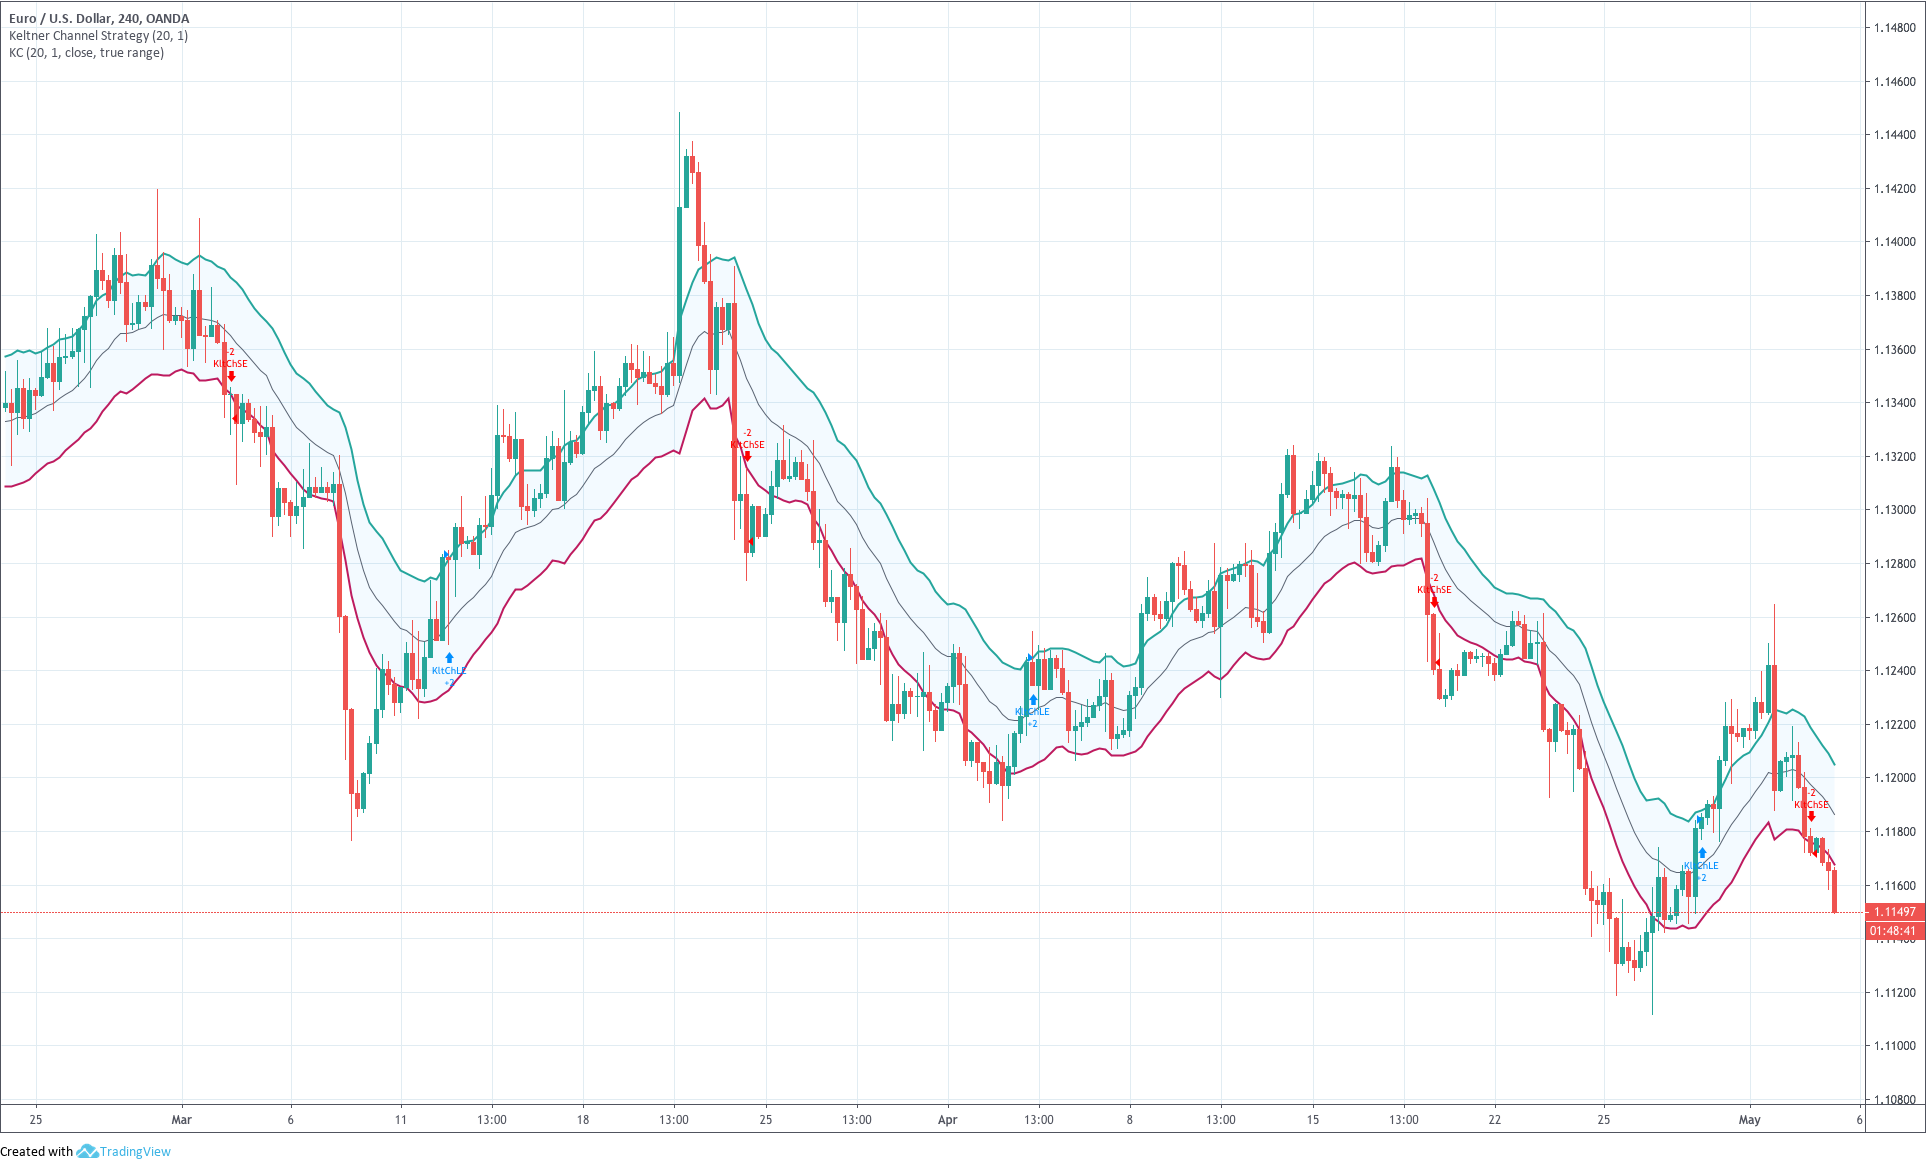
Chart 3 - 20-period Keltner Channels on the EURUSD 4H in the same segment than the previous charts
Trading signals
Buy when the price closes over the upper line and sell when it closes under the lower line.
Variations on the Keltner Bands
The Keltner system buys strength and sells weakness. Therefore it may result that, when the entry signal is triggered, the price has already progressed too much and It’s near overextended. Therefore, traders currently use a modified system more in tune with modern market behaviour.
- Instead of buying the crossing of the upper line, they sell it, and vice versa. The logic being to sell strength and buy weakness, because trading ranges are more common than large trends nowadays. The downside is not being prepared to catch an extended price movement.
- They may shorten the periods of the range and average.
- They use the system to assess trend direction and go to a shorter time frame for the entry signals. If the price crosses the upper line, signalling a bull market, the trader waits for the shorter time frame to hit the lower line of the Keltner channel.
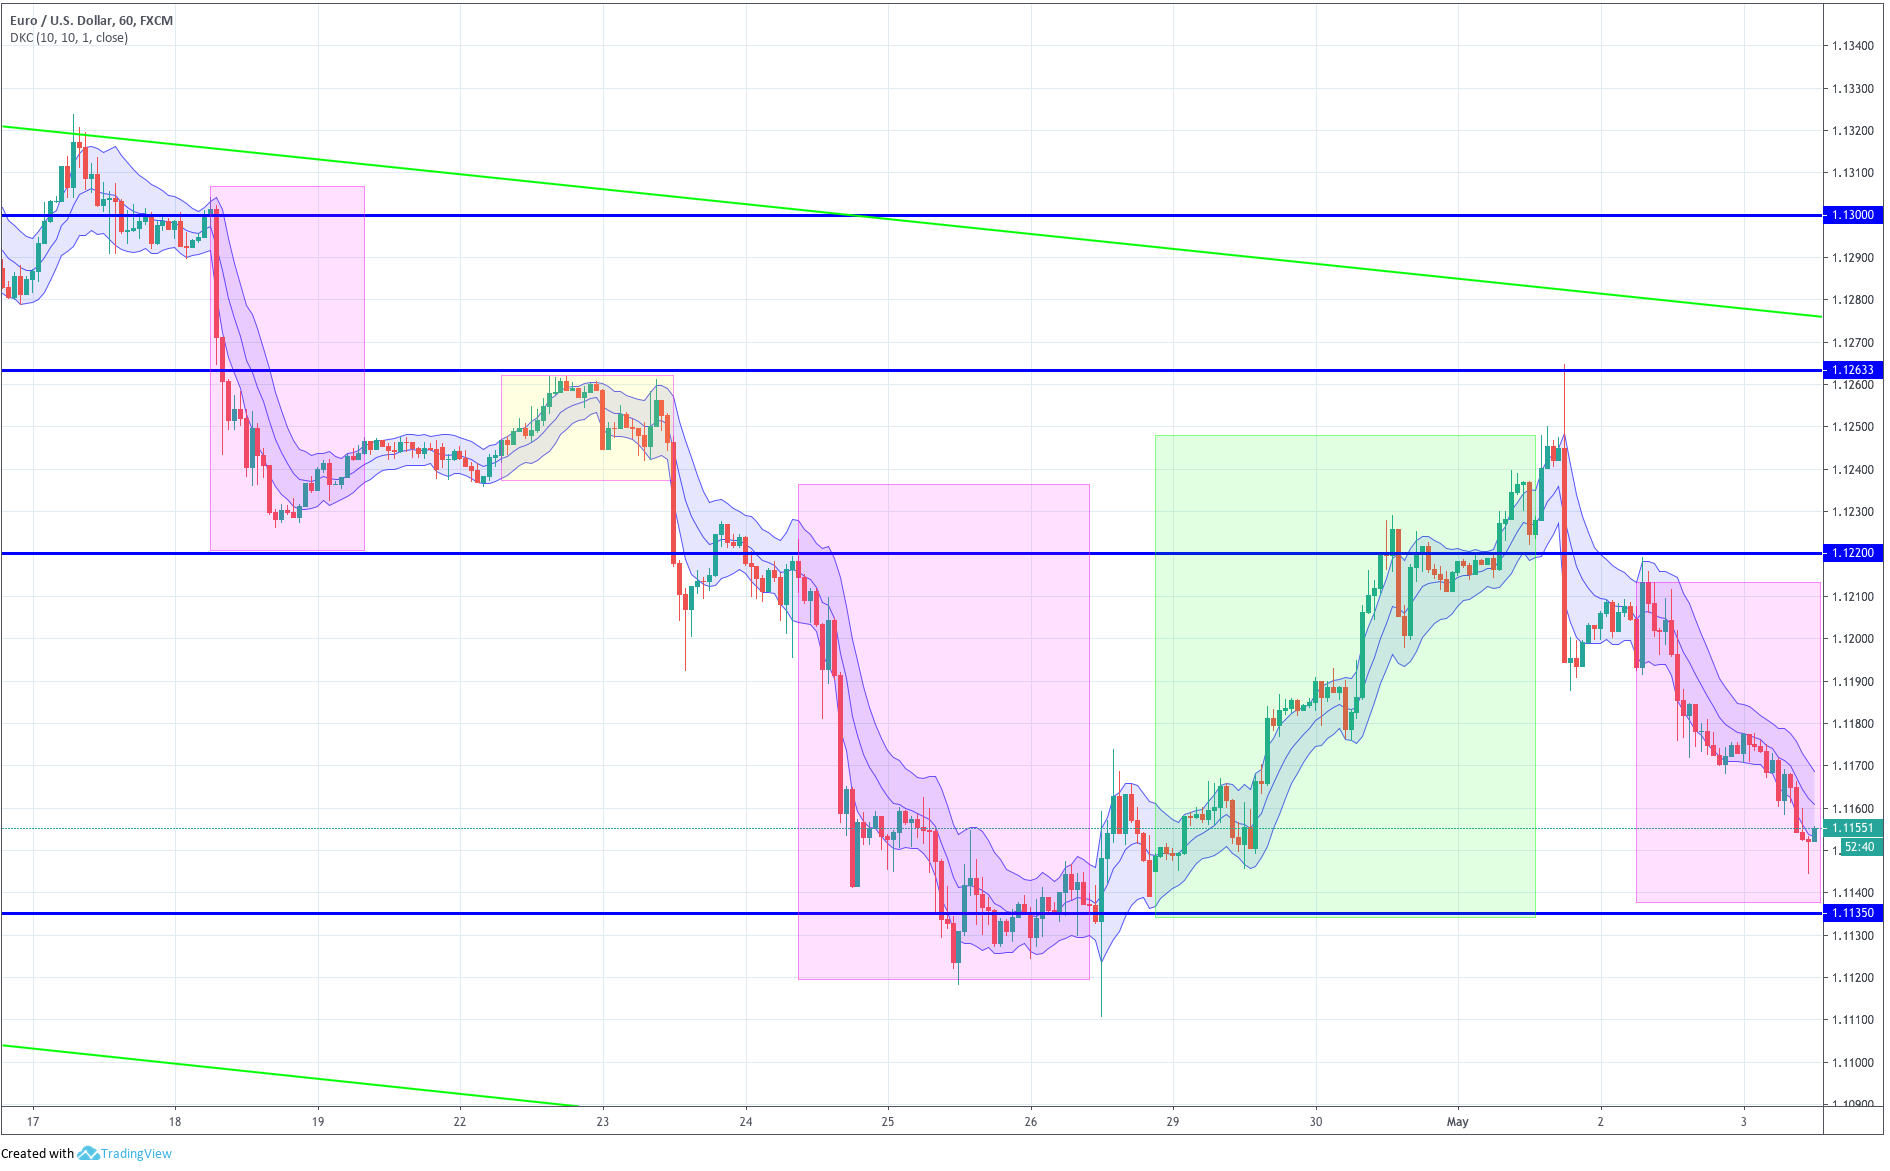
Chart 4 - 10-period Keltner Channel on the EURUSD 4H chart showing the trading areas for long and short trades.
Chart 4 shows a strategy to trade Keltner bands using a 10-period moving average.
The slope of the moving average defines if the trend is up or down.
A Sell signal arises when the price touches the upper Keltner line, and the MA is pointing down (selling at resistance). A buy is open when the price hits the lower band, and the 10-period MA is pointing up (buy at support). The system forbids trading against the trend, avoiding reactive legs.
A short exit occurs if price crosses over the 10-period MA; while a crossing below it closes a long position.
In our next article, we will analyse one of the most successful systems around The Donchian Channels.
References:
Computer analysis of the Futures Market, Lucas & LeBeau.
New Trading Systems and Methods, Perry Kaufman
