

Downloading, installing, basic concepts, and optimizing tips
Hello, traders, this is a small guide to help you get acquainted with MetaTrader 4. We will show, also some nice and helpful tricks
Download and installation
You can download your MT4 directly from your broker’s web page. There you should find a software download page. Just click on the proper link to download it.
After it’s downloaded, you can launch the install application which should perform an automatic installation into your computer.
Logging-in
Once you have launched your MT4 app you have two ways to log to your trading account.
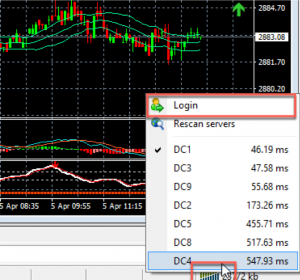
Method one:
By clicking on the bars icon, on the lower right of your MT4main window.
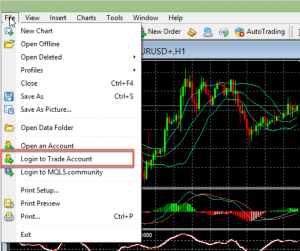
Method Two:
By clicking on the file menu -> login to trade account
On the login field, you should enter your account number, password and server of your account.
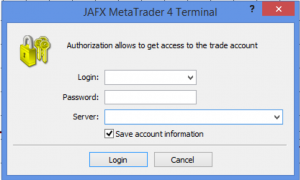
Alternatively, if you don’t have an account already set, you could open a new one by clicking Menu -> Open an account. A menu to open an account will pop up.
Main Windows
After logging in your trading platform will open
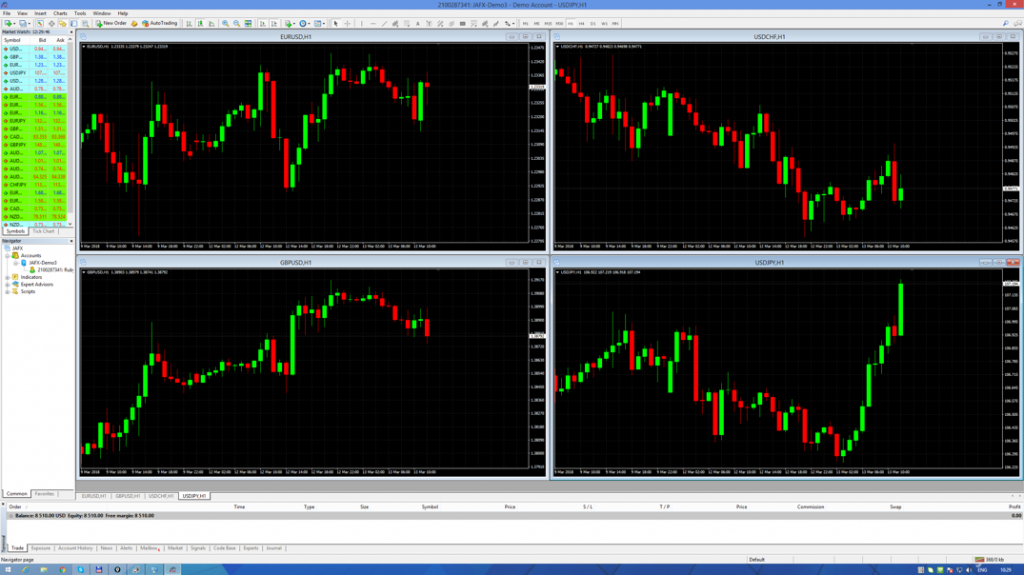
Your trading platform has several windows that you need to get acquainted with.
Market Watch
This area shows the live prices of the securities of interest.
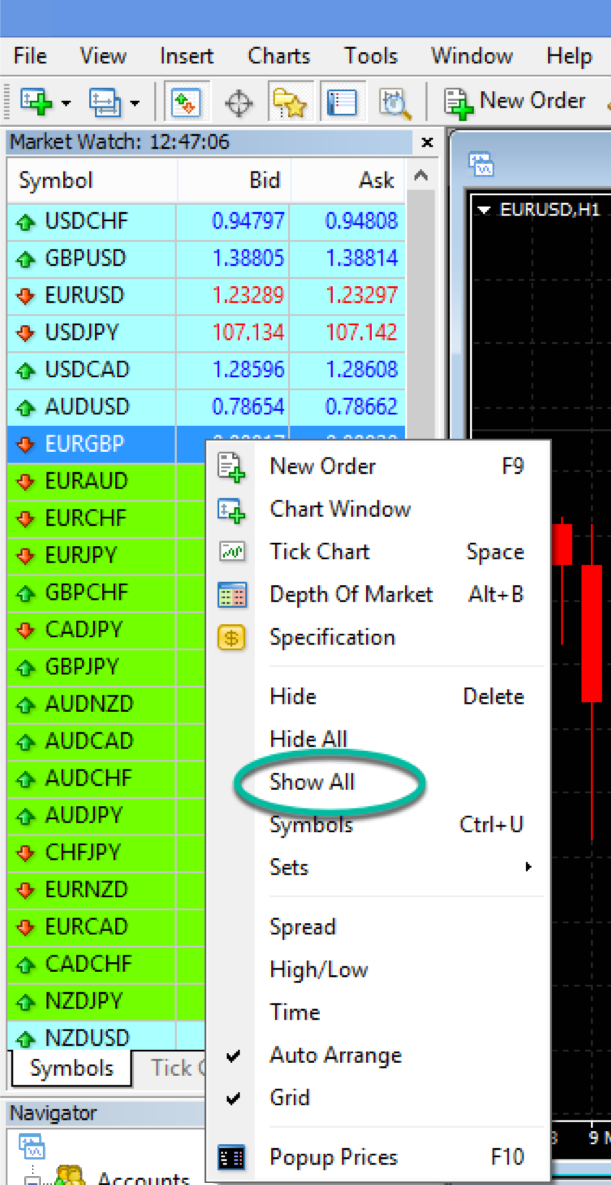
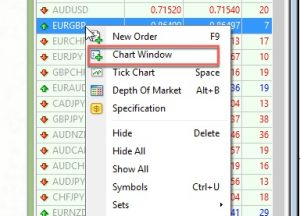
The Market watch shows the bid-ask prices of the forex pairs your broker offers to you. Not all possible assets are included in the window by default. Therefore, the first thing you need to do if you want to view all assets is to right-click any place of that window and then click on show all.
That will reveal all hidden assets, including cryptos selected stocks, indices, and metals.
After you’ve selected the asset or assets of interest, and have its charts opened, you can go to the context menu and click hide all. When you do that, only those assets with charts will be shown.
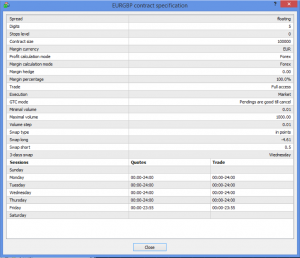
On that menu you, if you click Specification, you’ll get the specifications of the highlighted contract, in this case, EURGBP (click on the image to maximise it).
The Market Watch window shows only bid and ask by default. You may add other columns by right-clicking and select them: Spread, High/Low and Time.
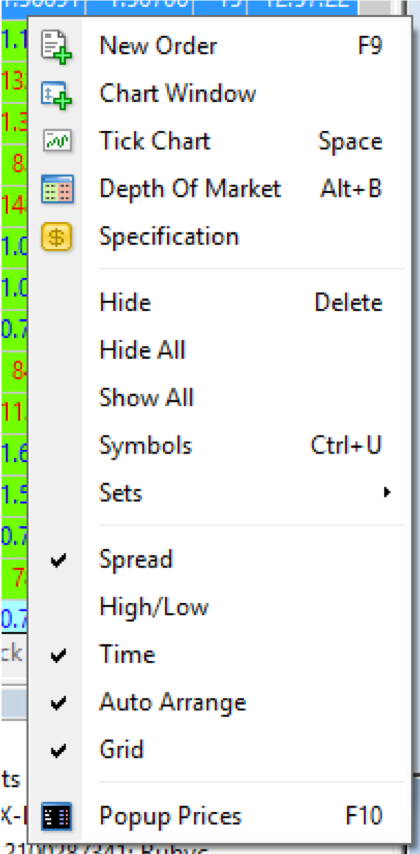 If you decide to trade only a determined basket of assets, you can delete the rest and keep just your choice by right-clicking and choose Hide—Delete.
That way you could have separate baskets, saving them and retrieving them with the Set sub-menu.
Organising your Market Watch
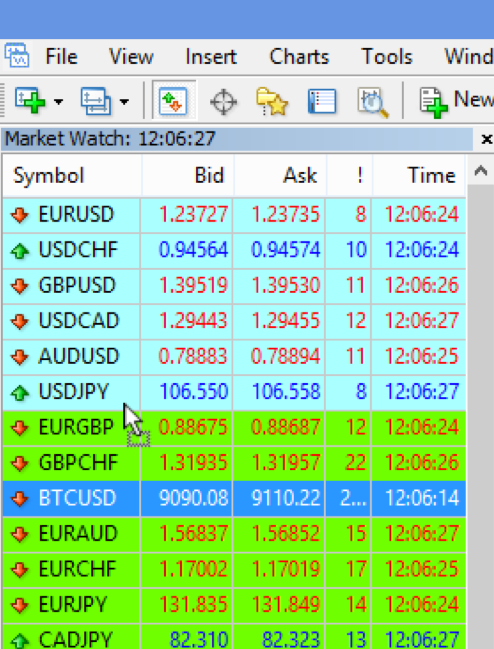
Probably you don’t want to continuously search for your favourite pair hidden in a sea of assets. To set the assets you’re interested in at the top of the stack, you simply left-click and drag it to your desired place. In this case, we are dragging the BTCUSD to be placed above the USDJPY.
Charts Area
The Charts area is the central part of the MT4 platform for a trader. The factory default shows four windows, presenting four currency pairs, EURUSD, USDCHF, GBPUSD, and USDJPY.
Of course, you can quickly add more. You can do it using two methods. The first is right-clicking the desired asset on the MarketWatch window and click chart window. You could arrange the new set on the screen area easily by clicking on the Window menu and then on Tile Windows, or using the Alt+R shortcut.
We’ll come later to deepen in this subject.
After you have the right chart selection, you can get rid of all pairs shown in the Market Watch window by right-clicking on the MarketWatch window and select Hide all.
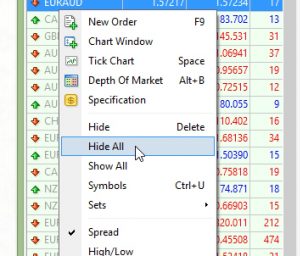
That way you’re left with only the pairs with an open chart
![]()
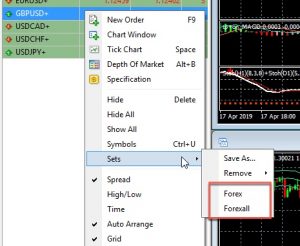
You can save your selection by Sets->Save As…
This allows saving several pair sets and retrieve them swiftly with the context menu again, by clicking on its name.
The Navigator:
This window allows getting quick access to various features of the terminal. It can be opened/closed by pressing the shortcut key Ctrl+N.
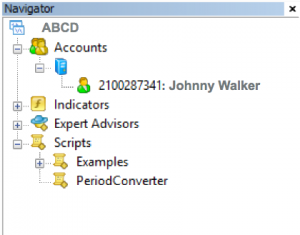
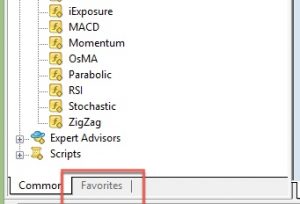
There, you’ll see the several groups: accounts, Indicators, Experts Advisors, and scripts.
The plus button opens new sub-folders and so on.
Favorites’ tab:
Intended for quick access to objects that are frequently used. You can drop there elements dragged from other folders, such as the indicator folder. This is very handy because you’ll collect there the most used objects instead of doing multiple clicks to find them.
Terminal
If you repeatedly hit Ctrl + T, the terminal appears/disappears at/from the bottom of your screen. This screen shows a lot of information about your account, trades and other useful information.
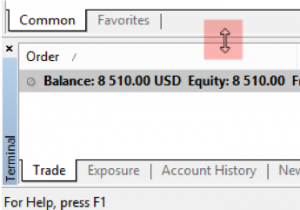
To give it more room just move your mouse to the upper border of this window until the arrow changes to a double vertical arrow. Since Ctrl +Tswitches this window on and off, there is no need to let it as a thin window at the bottom of your workstation. Make it as large as you like and study comfortably your trades, account history or whatever information you need to look at; and after you no longer need it, press Ctrl +Tagain and it will disappear.
Main Menu:
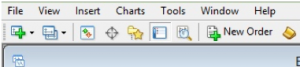
The main menu of this platform, located at the top right of its window is the head of a set of sub-menus:
File
Working with charts, storing history data and profiles, account management, login, and print.
View
Language, Toolbar setting, and managing command windows.
Insert
Adding technical indicators, line studies, and other objects.
Charts
Managing objects added and changing the properties of a chart.
Tools
General settings of the trading platform, History Center, global variables, and MetaEditor.
Window
Managing and arranging chart windows.
Help
User guide.
Main shortcuts:
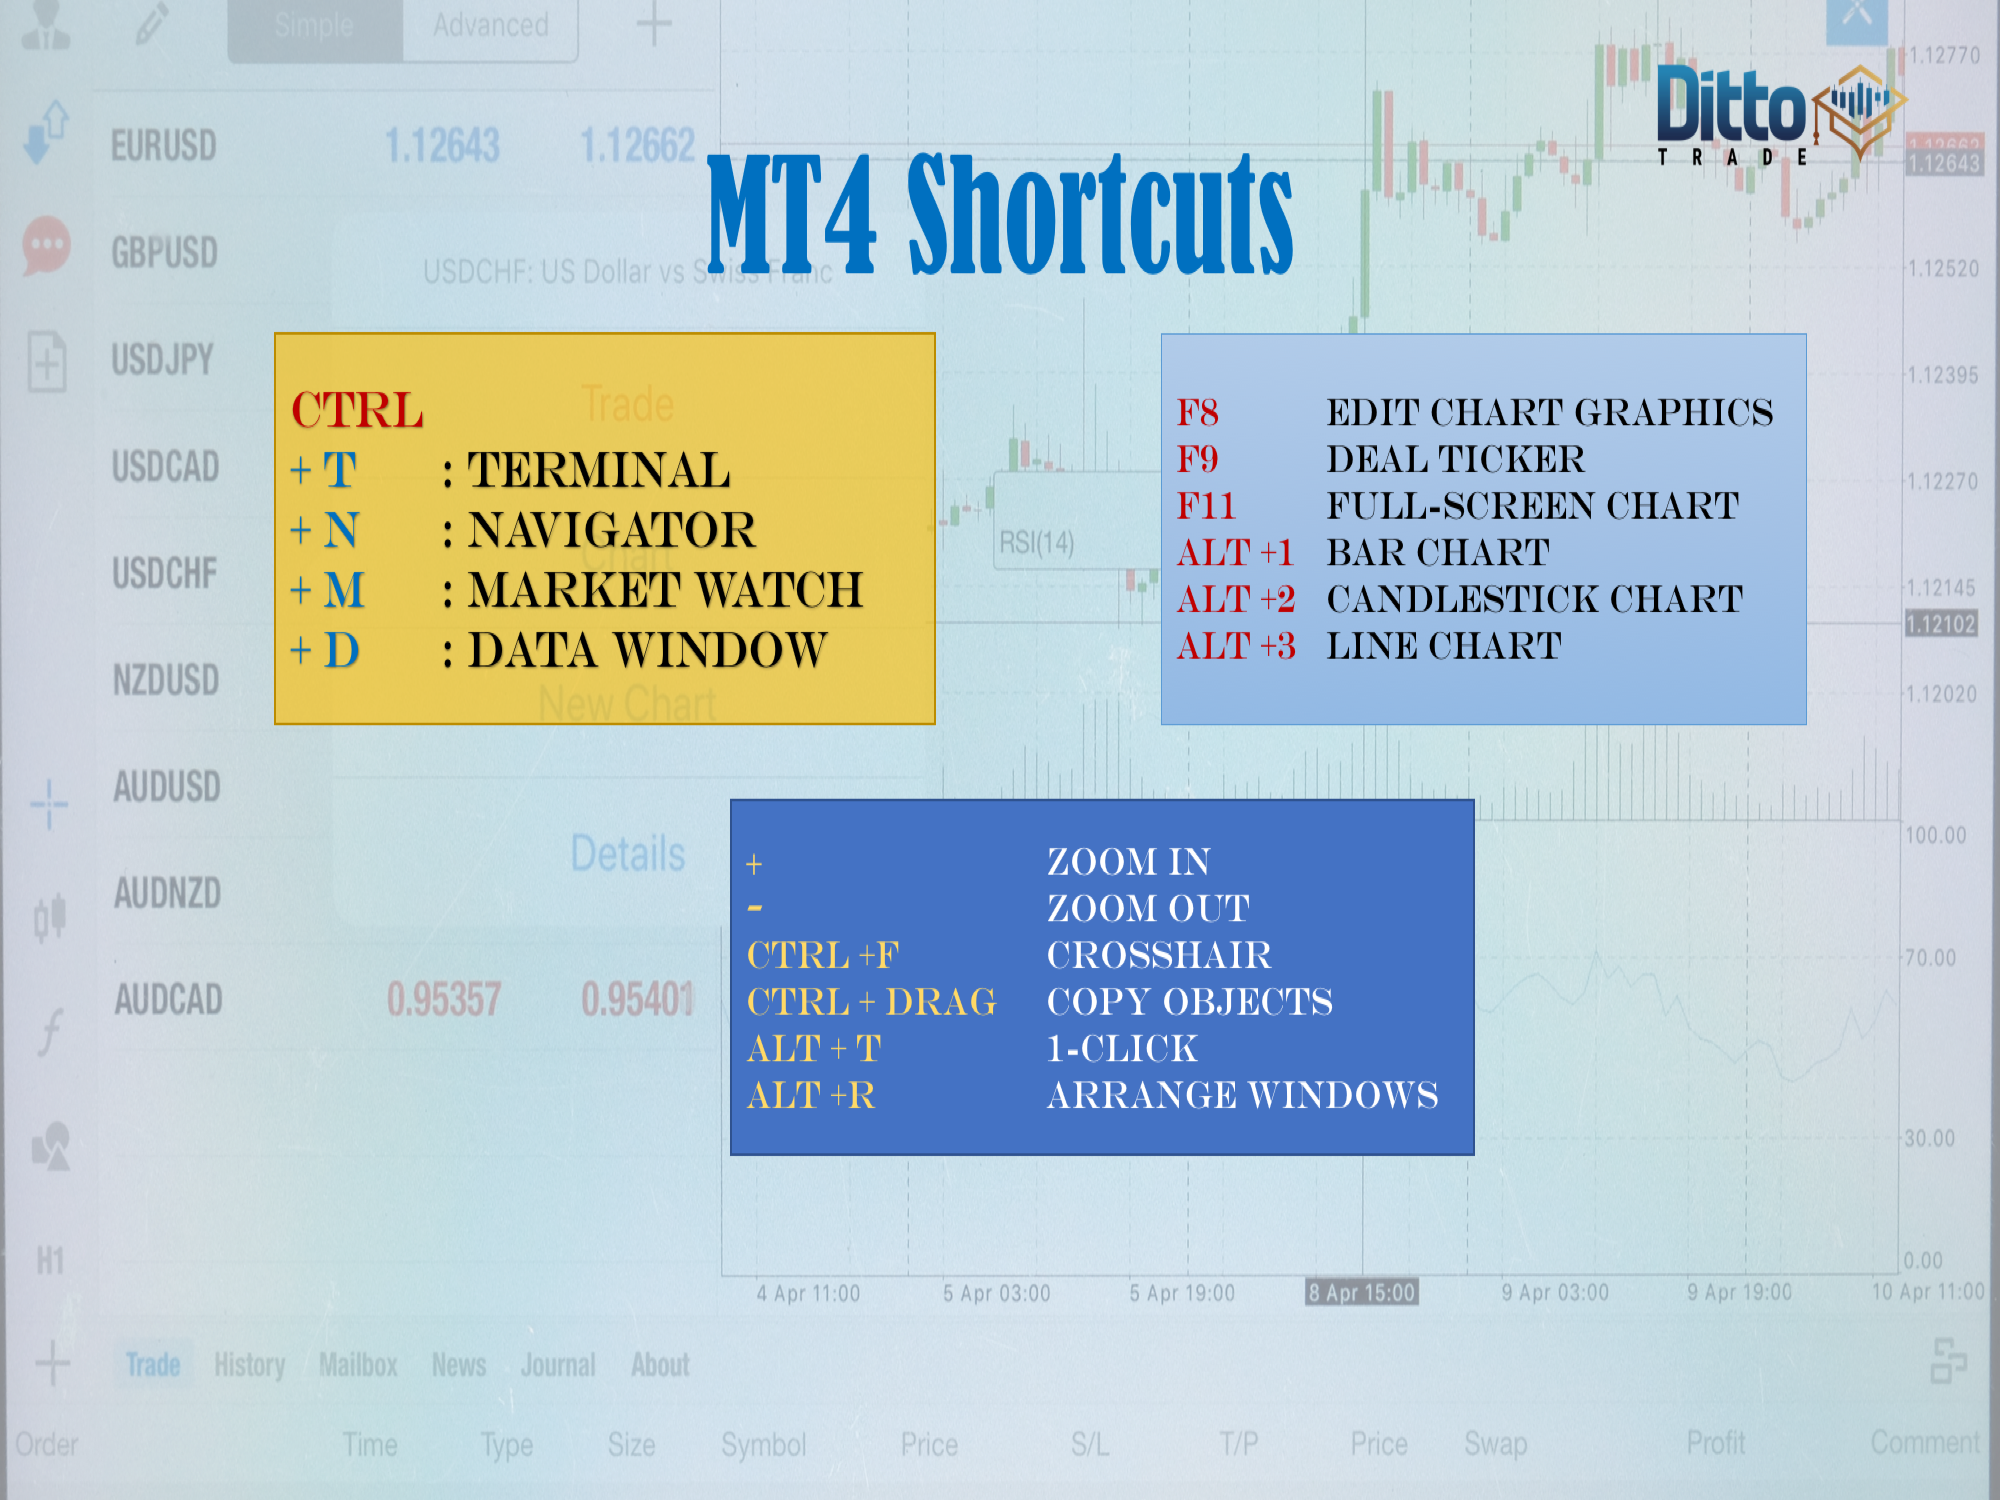
These shortcuts are crucial because it allows you to speed up your terminal operation.
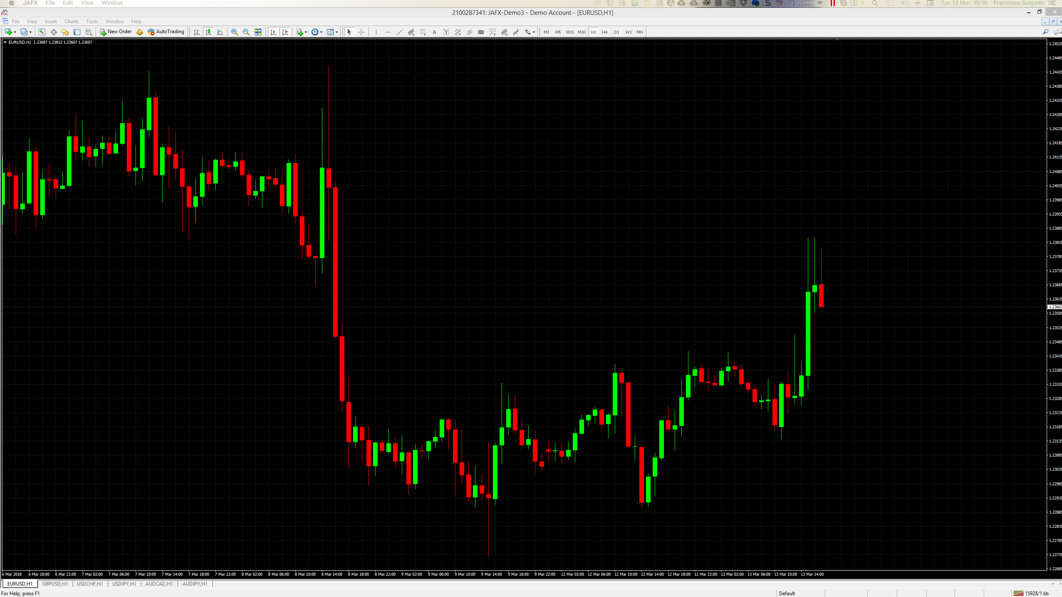
Tips and tricks to optimize your trading environment
The usual way your trader workstation appears after you’ve downloaded it shows a lot of information, but when you’re analysing charts, you just need one, and nothing else. Therefore, by double-clicking your desired chart, you’ll be able to maximize it. Also, by pressing Ctrl +T, Ctrl +N, and Ctrl +Myou’ll hide the Terminal, Navigator, and Market Watch windows. The final result is something like this:
Now, you may customize the toolbar with just the tools you need, and get rid of everything else.
There are for kinds of toolboxes. If you right-click on each of them, you’ll see a pop-up menu that at its bottom says “customize.”
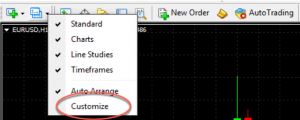
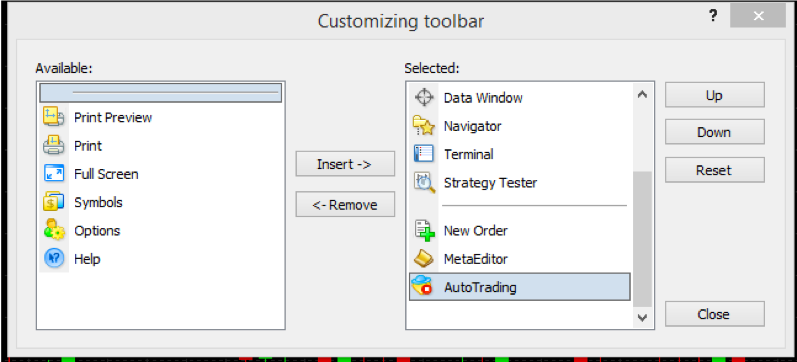
By clicking it, you can add and remove functionality, which in this case is:
In the case of the lines and figures toolbar
![]()
is:
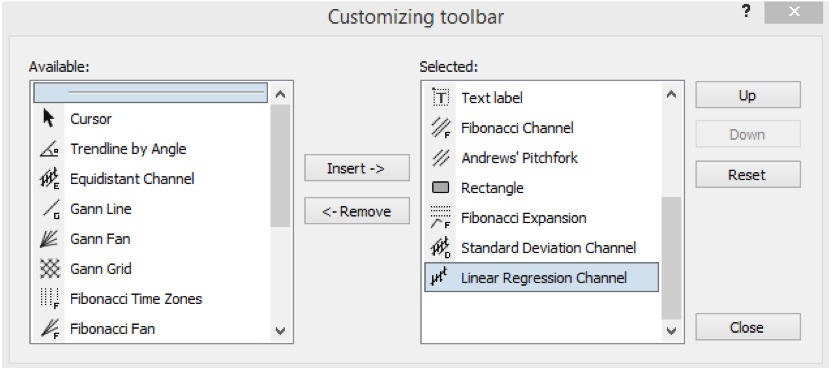
You can click any object on the left table and insert it into the selected objects on the right.
Chart setup
Usually, the grid shows not much information and may be annoying to you. If you don’t like grids, by pressing Ctrl+G you get rid of it.
If you want to switch on or off the day separators, use Ctrl +Y
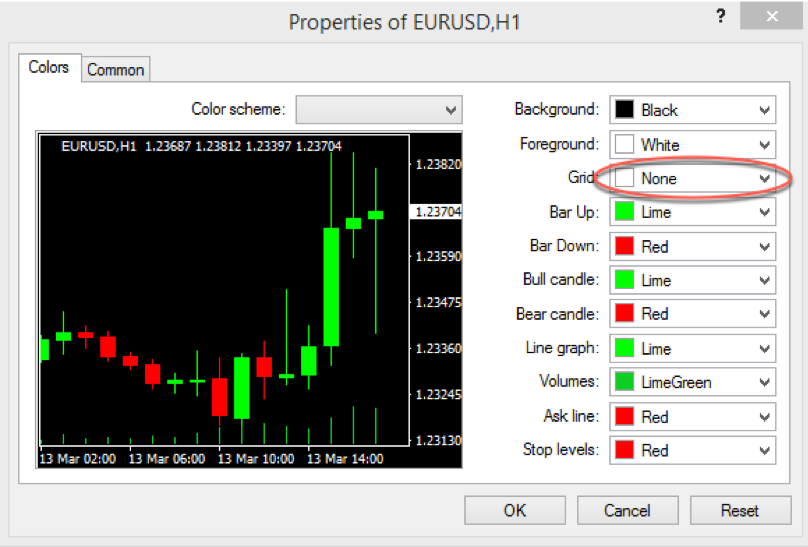
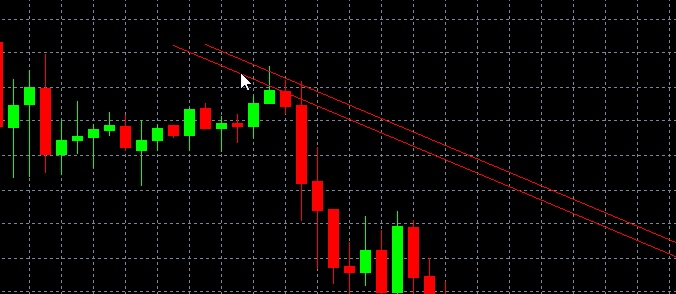
Finally, to get rid of the horizontal price line, that interferes with your possible horizontal lines you press F8 and write None in the grid setting:
Populating the Favourites’ tab
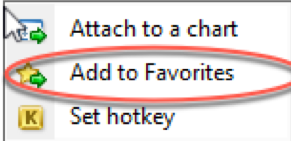
Usually, you’ll be using a handful of indicators. Maybe two at the same time. Adding them to a new chart is painfully slow. To help you avoid losing time, add them to your favourites’ tab, by right-clicking on it and selecting Add to Favorites.
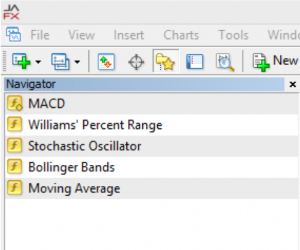
For example, Williams Percent R, MACD stochastic, Bollinger bands and a couple of moving averages are sometimes handy. Once included, you don’t have to search for your favourite indicator, just double-click on it to add it to the selected chart.
Hotkeys
We already know how to populate the Favorites’ tab for fast access to our usual indicators. There is another nice trick to speed up our indicator entry on a chart.
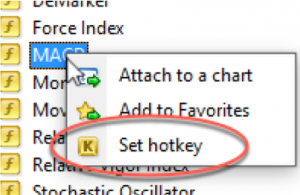
You could add a hotkey to it, so the indicator appears every time you press that hotkey. So, if we set Alt +M as the hot-key for MACD, we’ll get the MACD popup window on our chart every time we need a MACD indicator. That way we will save, even, the time to go to our favourites tab to drag it.
Moving Averages are frequently used in charts. A nice MT4 feature is that you could modify the custom Moving Averages for your convenience. If, for instance, you are using very often the 20 the 50 and the 200 MA, you can build a custom copy of each of them, modifying it very easily with your MetaEditor, and add a hot-key to it.
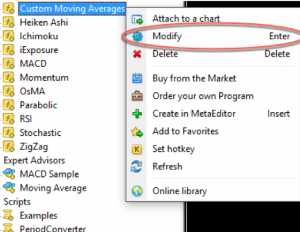
To edit the Custom Moving Average, you right-click on it and select Modify.
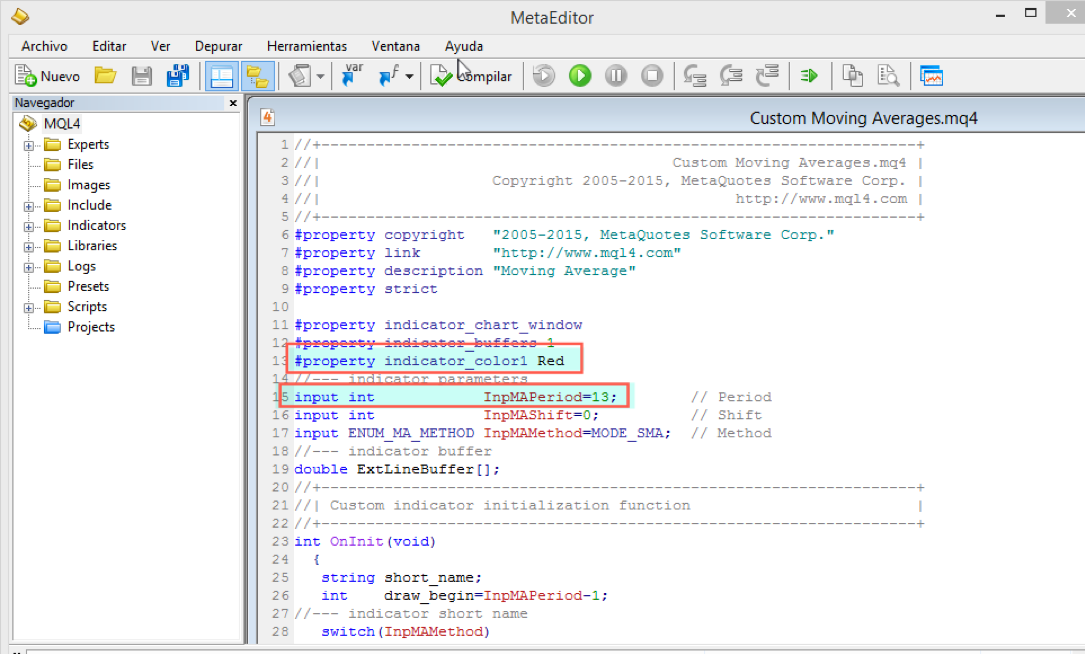
The MetaEditor will open with the modifiable moving average. There we are just modifying the colour and period, compiling and save it with a different name. Therefore, we can set two or three usual MA periods, with different colours for each period, and, after setting a hotkey for each one. (click on the image to enlarge it)
Now, We can define a hotkey for every one of these moving averages. Check first in the User Guide that the keys you’d like to assign are not already attached and do it.: For instance, Ctrl +2 to the 20 MA, Ctrl +5 to the 50MA, Ctrl +1 to the 100MA and Ctrl 0 to the 200MA
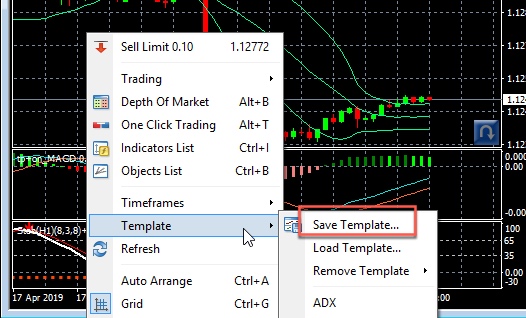
After you’ve finished a basic chart template you’re comfortable with, you should save it by right-click the chart window -> Template -> Save Template and name it “Default.” That way every time you open a new chart it will be open using your favourite setup.
There is one issue you should know about templates. Let’s say you’ve been working for weeks or months in a chart with lots of trendlines, support, and horizontal resistance lines, Fibonacci drawings, etc., and one day you wanted to watch the chart using another template, with other nice stuff there. By the time you wanted to go back to your first chart configuration, you’d lose all your work. Therefore, you should save your work in a custom template, before jumping into another one.
Adding objects to a chart
Adding objects to a chart, copying them and moving them around are actions we are continually going to do. So, to make things a lot easier for you, let’s do something that will make your life a lot easier:
Ctrl +O(options) will pop-up the options window, there, we’ll click the tab objects -> and “Select object by single mouse click”.
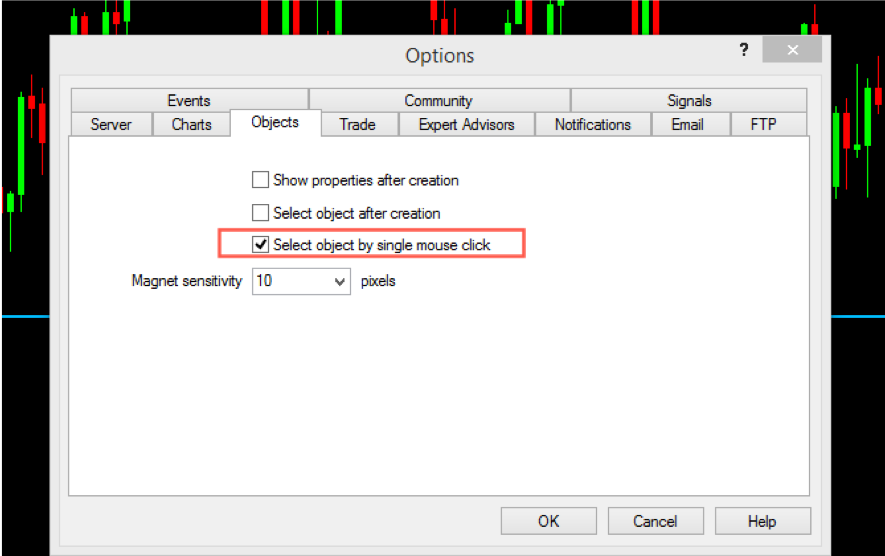
From now on, we can select by just clicking. Next, a click and slide action will drag the object to another area, while Ctrl + click + slide will copy it and we could drag it, keeping the original object in its original place.
We can also select several objects and delete them at once.
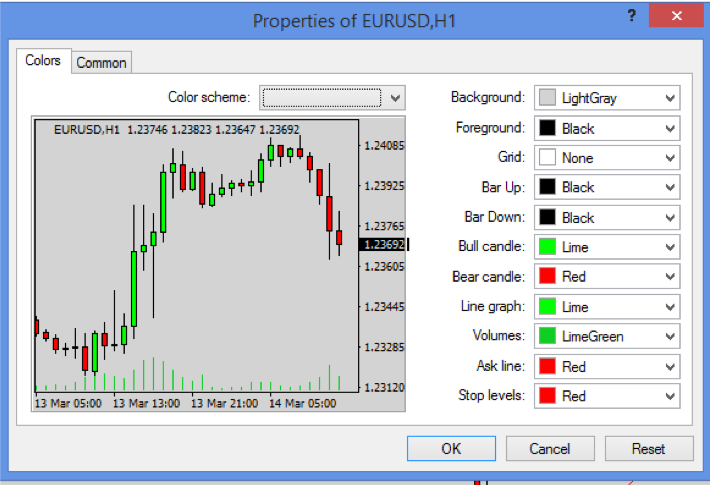
Chart properties
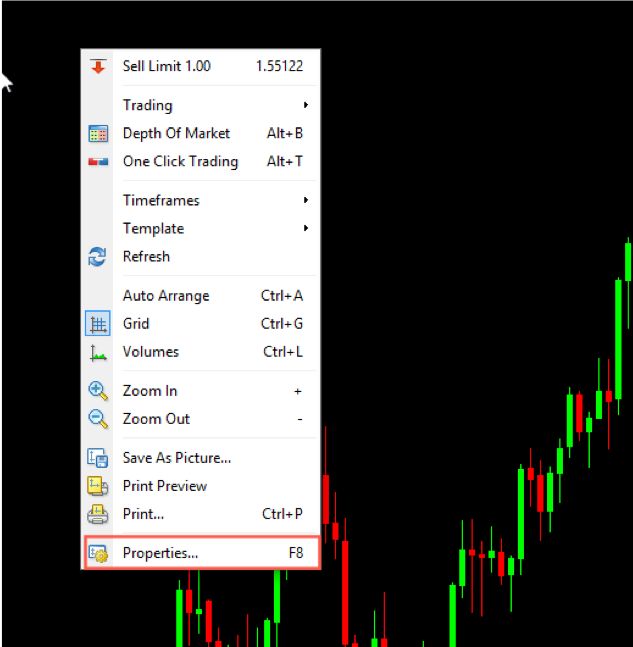
Chart properties are accessed by right-clicking on the chart and select “Properties…” at the bottom of the menu bar, or by pressing F8 on the contextual menu.
And the properties window shows up:
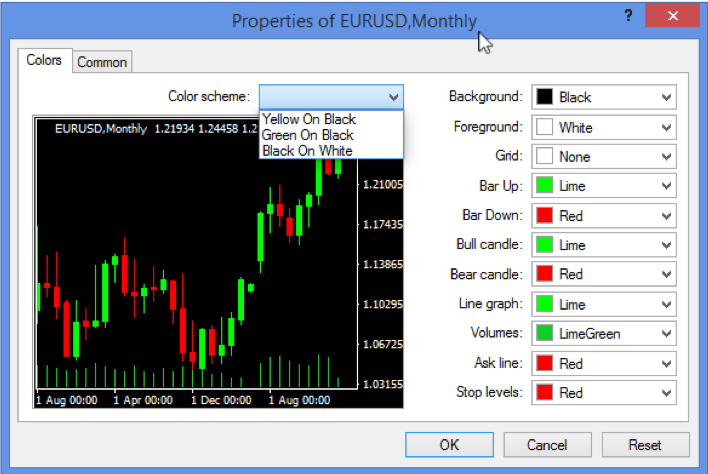
There are three color schemes, but you can customize them at will, by modifying the color boxes at the right of the window.
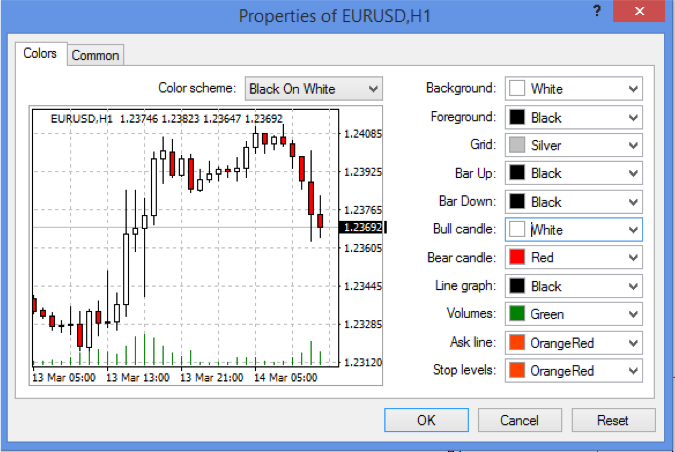
If you’re found of white background screens, a pleasant combination is achieved by first selecting black on white and then change the bear candle to red.
If you don’t like white backgrounds, then Black is as good as any color. My preferences for black background has been shown already: Green on bull candles and red on black ones.
If you prefer light backgrounds but find white too bright, you may choose a kind of grey or other combinations that may suit your style. One that is, also very appealing is this.
As a final note, Please don’t forget to save your work, including templates, and save your favourite template, the one you want for a new chart, as Default.
Since template saving includes all objects in your chart, it’s wise to use this feature to save your analysis work. Please, do not make the error to save the chart using the File-> save, because this exports the chart as a CSV file, but it does not allow retrieving your work.
With that, we have finished the first part of this guide. In the second part, we will cover more in depth how to handle all aspects of chart setup and its different objects used for chart analysis.
