

BTCUSD seems to have given a clearer signal to the daily traders yesterday. Yesterday’s daily candle came out as a bearish engulfing candle. That is too has been produced right at the level of daily resistance where the price reacted on a number of occasions. This might have put the buyers out of the picture. Slowly but surely it is going to attract the sellers, which may lead BTCUSD to go towards the South in the coming days.
Let us have a look at the Daily-BTCUSD chart.
The Daily Chart
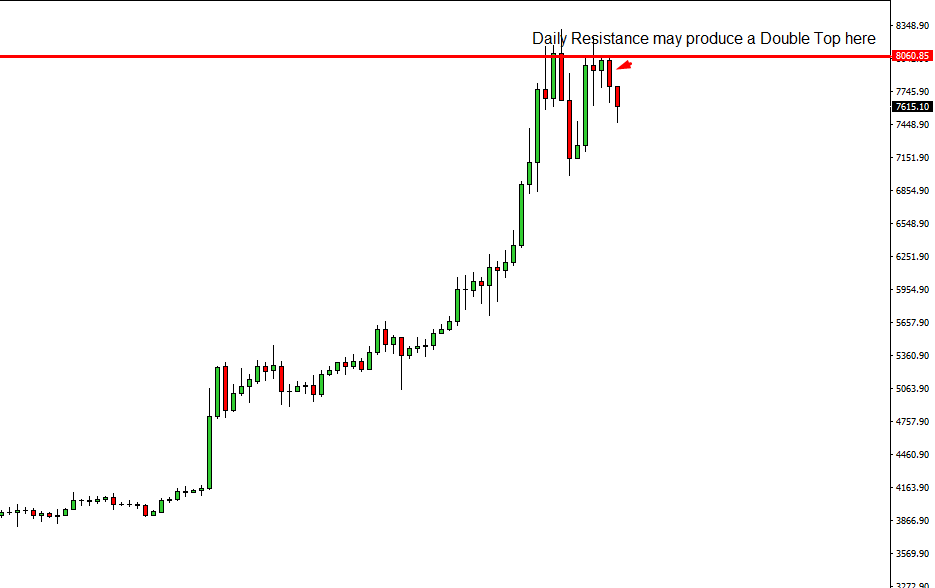
The daily resistance is clearly evident here. The level produced two bearish engulfing candles so far. The arrowed candle, which was yesterday’s candle, came out as the second engulfing candle. These are the signs that the level may produce a double top here. If that happens, then BTCUSD sellers are only going to look for the opportunities to go short on the pair. Potential neckline level of the double top is still far away though. However, by looking at other equations, it seems that sellers have the upper hand over the buyers here.
Let us have a look at the H4-BTCUSD chart.
The H4 Chart
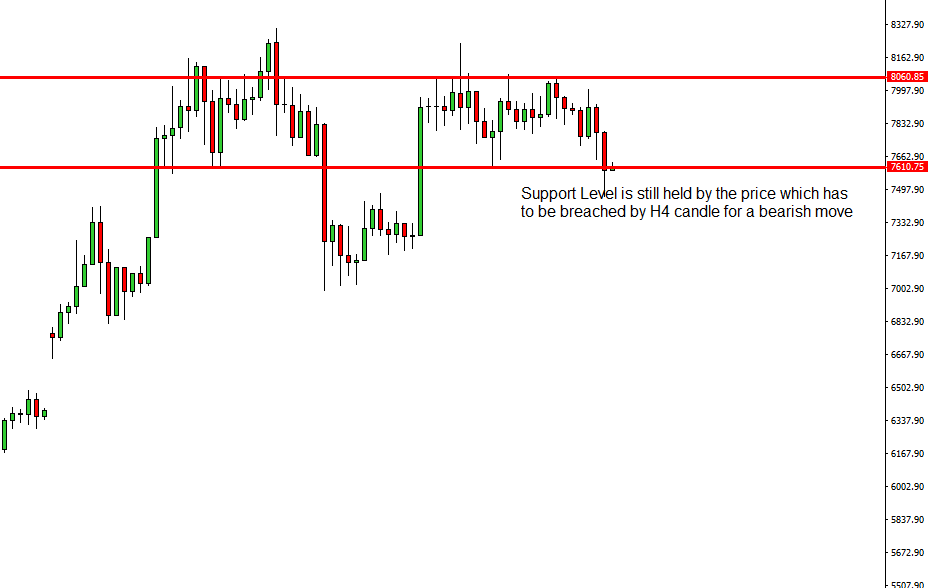
The H4 chart suggests that 8060.85 has been held by the price so many times, thus it has become a strong level of resistance. The level of 7610.75 has been acting as the level of support here. The level is still held, but the price has been roaming around the level. A strong H4 breakout is needed right on the support level for the sellers to start selling BTCUSD.
Today’s intraday price action suggests that the price may head towards the South as well. Thus, considering all the factors such as the daily chart, H4 chart and intraday price movement, BTCUSD sellers are going to take over the control soon. There still some equations are to be fulfilled for the pair to take the bearish route. Nevertheless, bearish BTCUSD looks imminent.
