

The trade is your friend. That is the famous saying. Traders are continually looking for methods to get in the right trend early and hold their position until the trend changes.
The Dunchian 4-week rule has been so far the greatest western method to accomplish the task. Point and Figure charting has its own place in this quest. From the East, we have recently studied the Renko Charts, which are aimed too at filtering out the market noise and keep traders in the right direction.
This time we are going to study another eastern method to catch and keep the trend: Three-Line Break charts.
This methodology can also be accomplished with regular OHLC charts, but the 3LB charts do the work for us.
What Do Traders Ask For?
All traders need strategies able to identify the trend direction with confidence, precise entry and exit points, early detection of the exhaustion of a trend and price-action-based stop placement.
The Three-Line Break method satisfies all these points.
This not-so-new Japanese method is of interest for traders because
- Just one way to determine a trend
-It can be used on short-term timeframes in combination with longer time-frames.
- It can be combined with Fibonacci to create a complete solution for traders.
Let’s learn first the method using regular candlesticks. This method considers that the open and the close are the most essential points of a candle, and disregards the wicks. So, the first measure we take is to remove them from our candlestick chart.
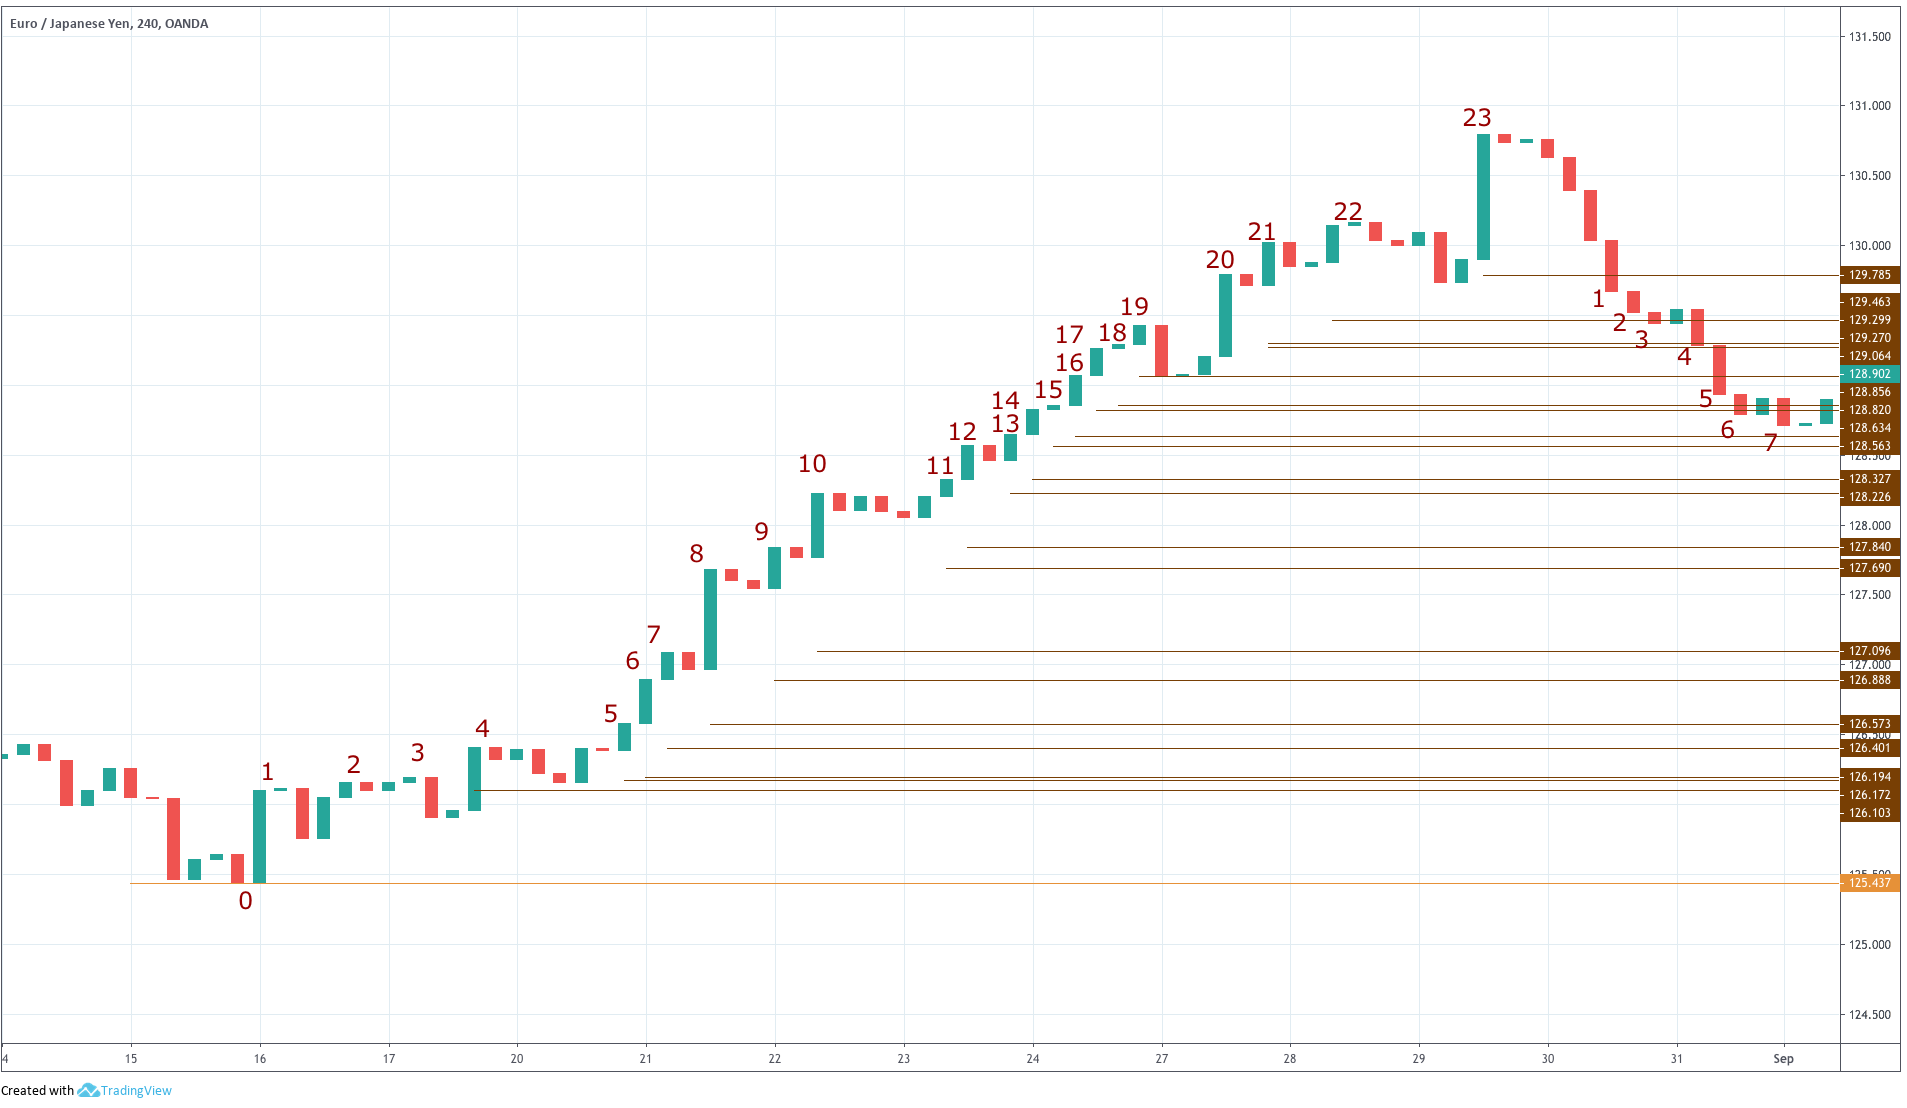
Chart 1 - The Three-Line Break Method using wickless candlesticks on the EURJPY 4H chart
On the chart above, we observe the price action of the EURJPY 4H cross using the modified candlesticks.
A starting point
To start our 3LB journey, we need a starting point. This point can be arbitrarily chosen, but the obvious one would be a clear lowest low, in chart 1 is marked as (0) at 125.437. Next, we observe a new candle which opened at the same level and moved up, closing at 126.103 (1).
This new price using this second data point we defined an up-trend, and we will assume it continues up unless the price moves below point (0). At this time, we don’t know if the trend will continue or reverses. What we know is that we will reverse our position if the EURJPY price closes below 125.437. This will be our entry point, which will be a long entry.
The next candle is almost flat, and on the following one, the price corrects to 50% of the initial bullish candle. We do not bulge, because there is nothing to do until the price closes below the established stop level or moves higher than 126.103.
The next two candles carry the price at 126.158 (2). Since this is a second high, the reversal level remains at 125.457. After two candles, a small one moves the price slightly up, to 126.194 (3).
The next candle retraces again, but soon a new level comes (4) at 126.409. At that point, we have reached our fourth high, so we move our break level to the third price (1) level (126.103). That way, we move the break level as the trend moves up.
All actions of line break change have been signalled by the horizontal lines on Chart 1. The break lines act as a trailing stop, but also as a reverse, in the case we’re following it in just one timeframe. Using multiple timeframes, we could filter out the shorts (or longs) in the case the higher one is still long (or short).
The same chart segment directly using a Three-Line Break chart shows several differences not contemplated by the 3LB method applied directly to the wickless candlesticks. For one part points from 1 to 7 are stacked in one large block. Then, after 19 and 22, there are turning points.
Chart 2 - The Three-Line Break Method on the same segment of the EURJPY 4H 3LB chart
Taking aside these slight incongruences with our original exercise, we see that Three-Line-Break charts show a similar aspect to a Renko chart, as they are formed by consecutive blocks, without consideration to the time scale. The difference here being the Three-line Break chart shows varied heights.
Trading Techniques with the Three-line Break Charts
Using a Three-Line Break chart, a trendless market shows as a series of alternating bull and bear blocks
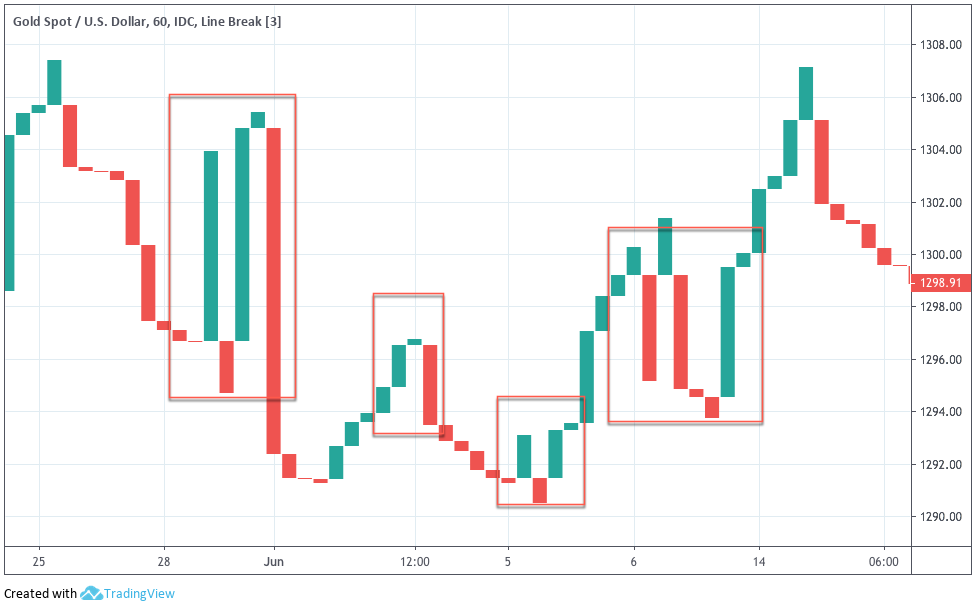 Chart 3 - Trendless segments as seen on a Three-Line Break chart
A reversal is seen when a brick engulfs three consecutive blocks
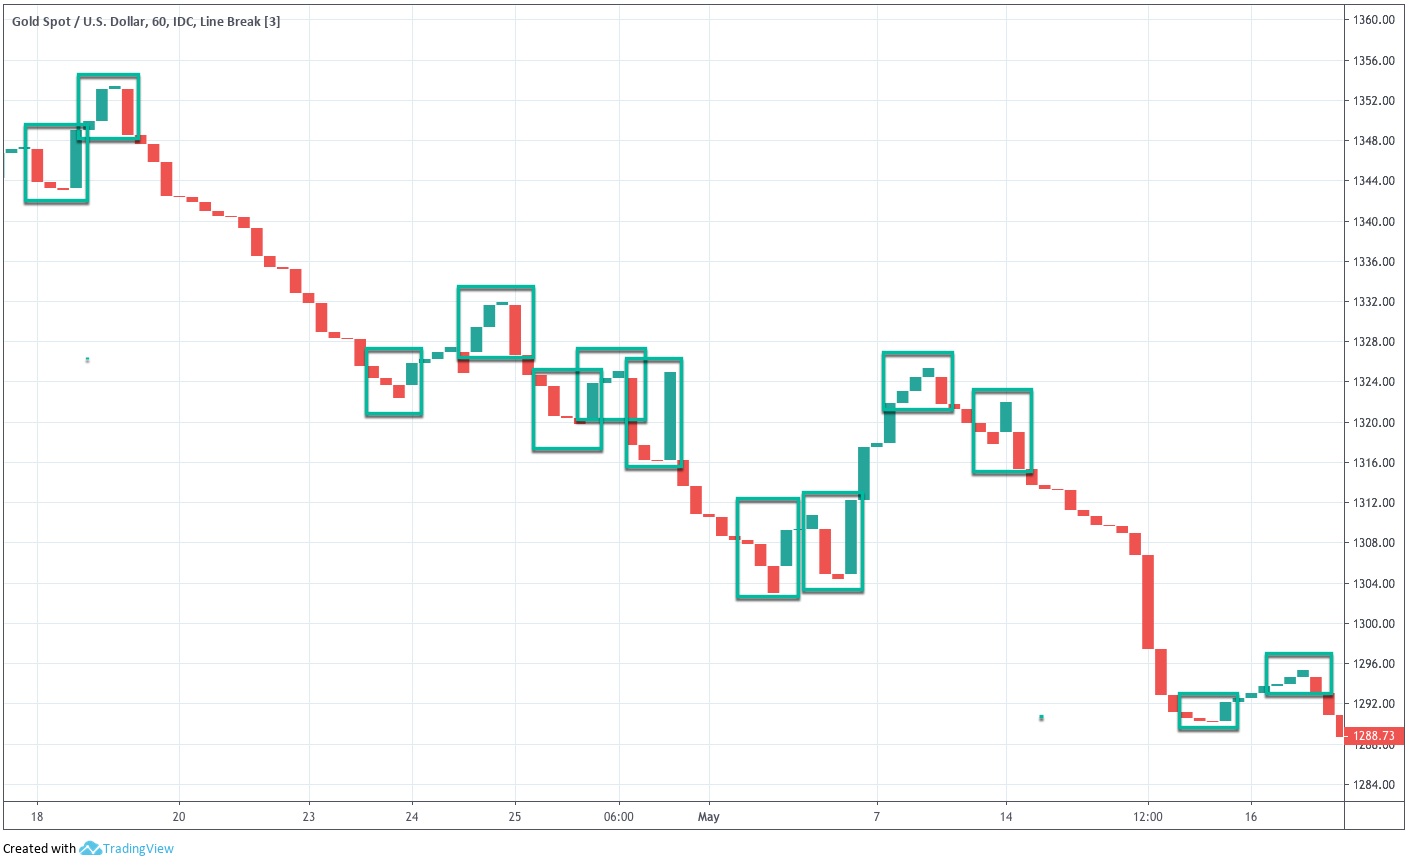
Chart 4 - Three-Line Break Trendless Reversals
The primary method to follow the trend using the 3LB charts is to buy on a bullish reversal block and sell on a bearish reversal block. Some traders might be comfortable using this strategy by knowing they caught the trend at a safer place than a bottom.
Since the market has to move three blocks before a buy or sell can be made, sometimes the price has moved too much into the trend and the reversal point, which coincides with the stop loss, or invalidation of the trend, is too far away. One solution to the issue is to use a shorter-timeframe reversal to get in early with a partial position and add more if it is confirmed in the main timeframe.
Using Three-Line Break and regular candlesticks
Steve Nison advises about using the Three-Line Break charts to assess the trend direction and then use regular candlesticks to make entry and exit decisions. For instance, if there is a trend reversal to the downside, the trend is confirmed to be bearish. On that basis, a bearish candle or pattern can be used to take short positions.
On the following example, an engulfing pattern is confirmed when at the same time the Three-Line Break chart shows a line break, on May 19, at 10:00 on Gold.
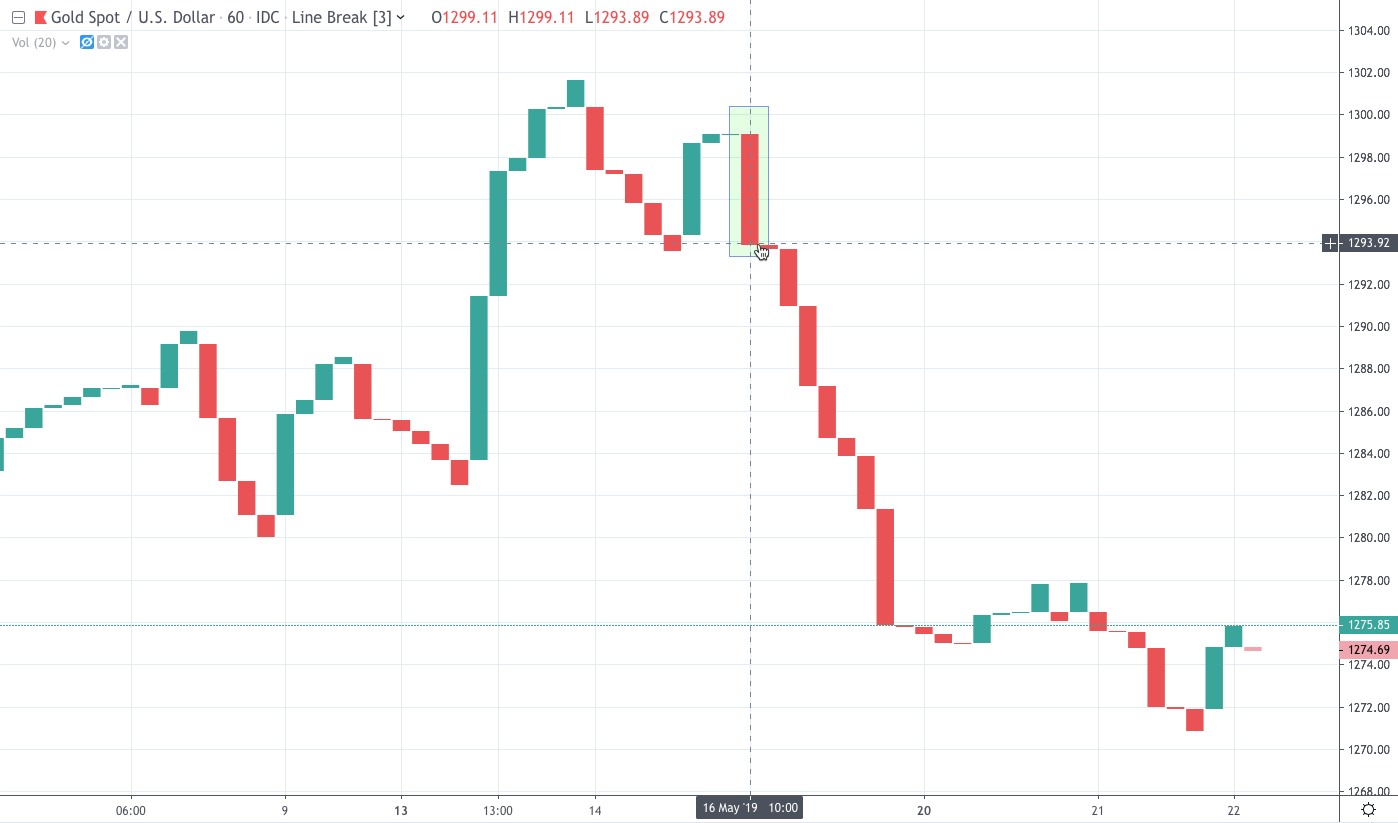
Charts 5 and 6 - Engulfing formation and price breakout to the downside confirmed by the Tree-Line Break.
The goal to mix both chart types is to optimise the risk-to-reward factor since the Achilles heel of the 3LB charts is, precisely, that often the reversal pattern shows a very bad risk profile.
Waiting for an Extra Confirmation
Some traders prefer waiting for more confirmation. To get it they wait for a new block to form. You may think that this will harm the reward-to-risk of the trade, and you’re right. Nevertheless, many times the block following the trend reversal is much smaller than the original reversal block, and when not, usually the reversal is strong enough to need for confirmation. The following chart show how this, Although we can’t see any benefit following the strategy. Maybe on choppy markets that make a difference.
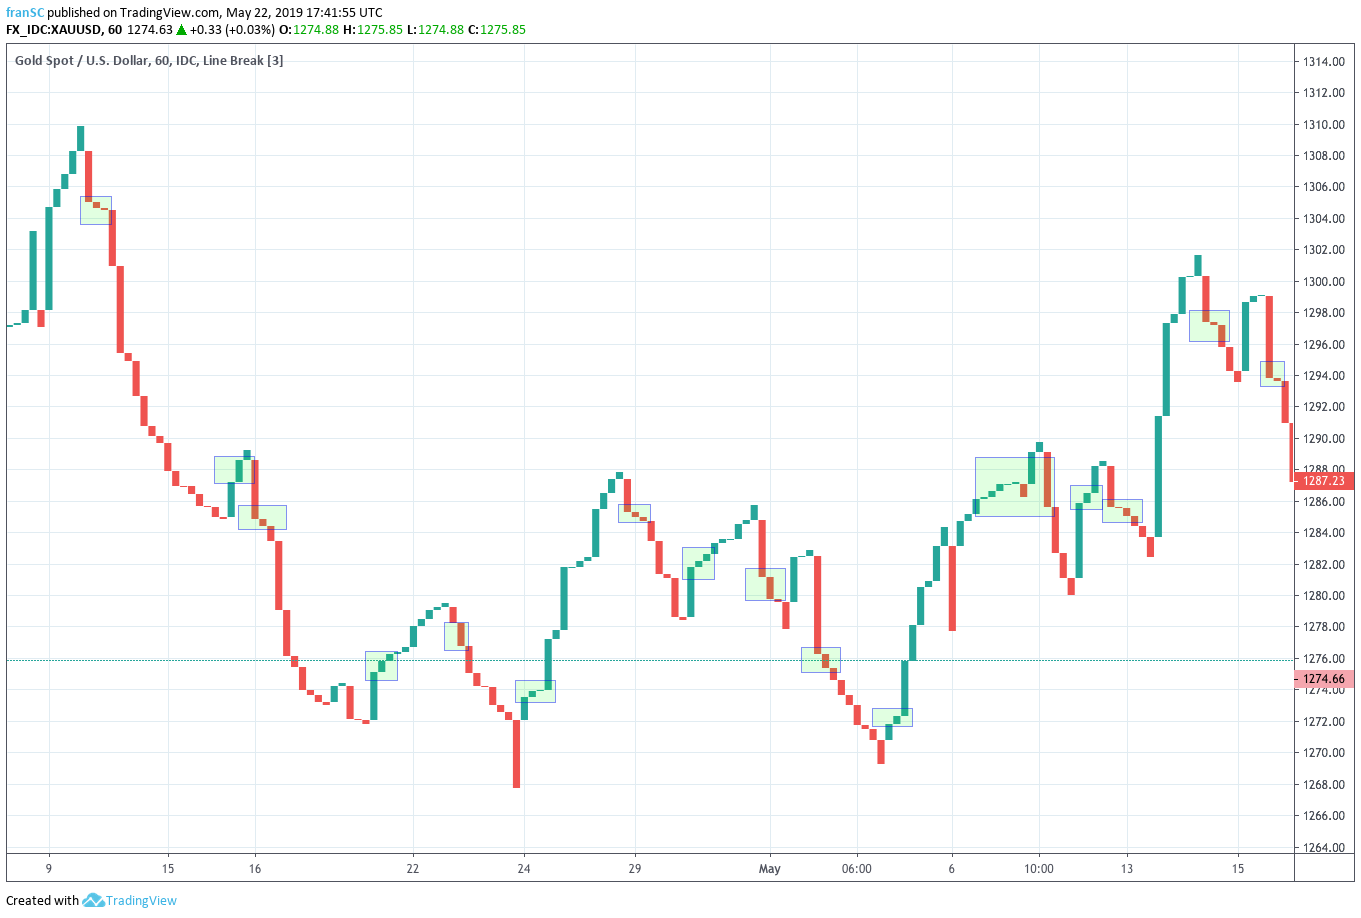
Chart 7 - Three Line Break chart Extra confirmation block
Black Shoe, White or Black Suits and Neck.
These are exhaustion patterns. The bullish pattern is created by a black shoe, then a white suit and the neck as a buy setup. The bearish pattern is the specular image: First comes the neck, then a black suit and finally a shoe.
The little body at the end of a downfall shows the selling pressure is ending. The white and large body is the turnaround. The small continuation white body, the neck is the buy signal. The specular pattern applies to bear setups. This pattern does not happen often and is not trustable when it goes against a major trend on a higher timeframe. Chart 8 below shows three instances of this pattern in the SPY ETF 1H chart, one bearish and two bullish.
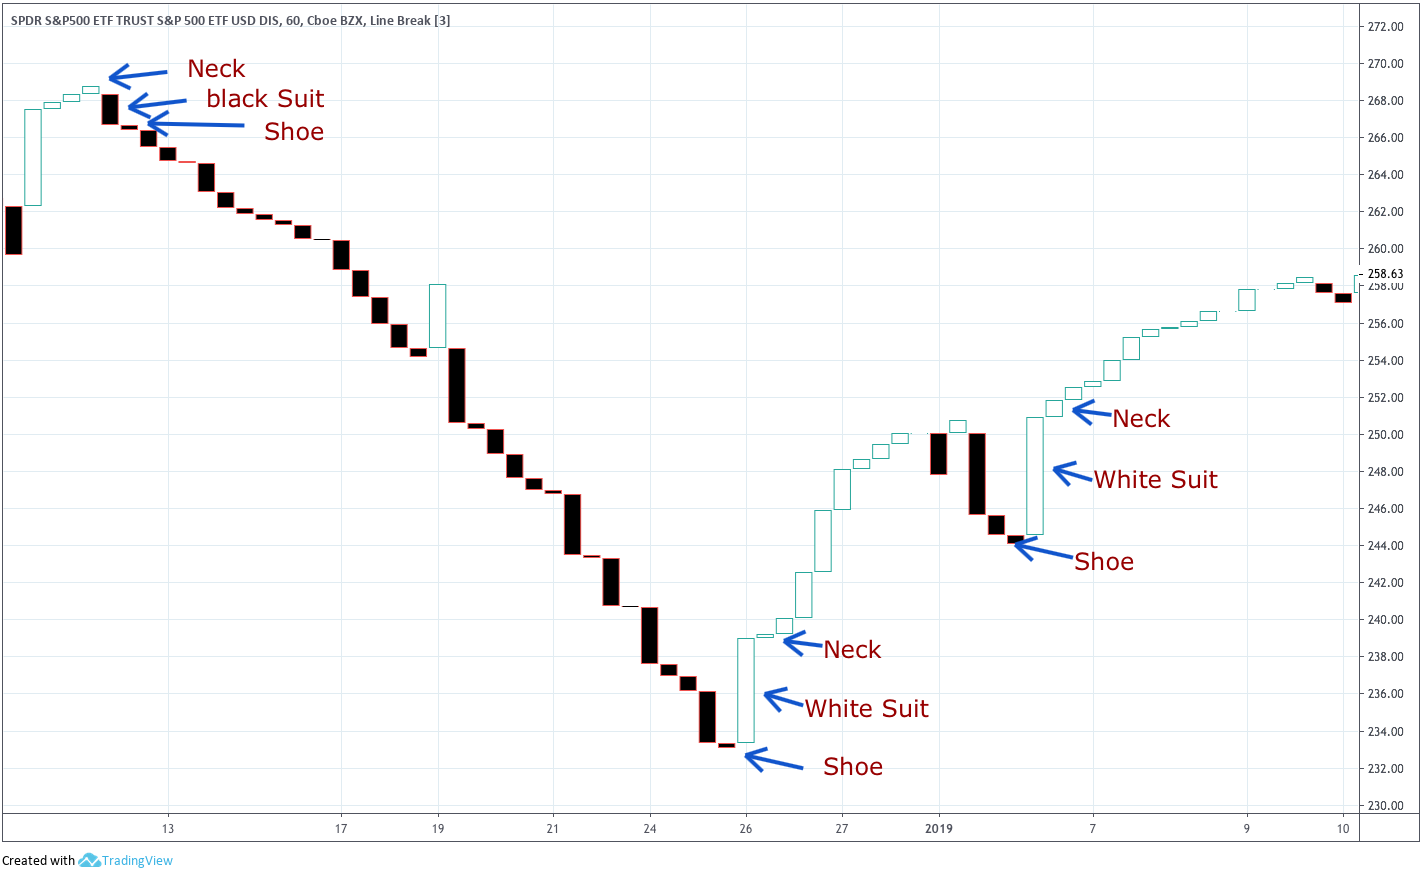
Chart 8 - Black Shoe, White or Black body and White neck
Western Charting and Three-line Break
We can apply to Three-line Break charts the same techniques as on regular charts. Support, resistance, double tops, trendlines, triangles and others.
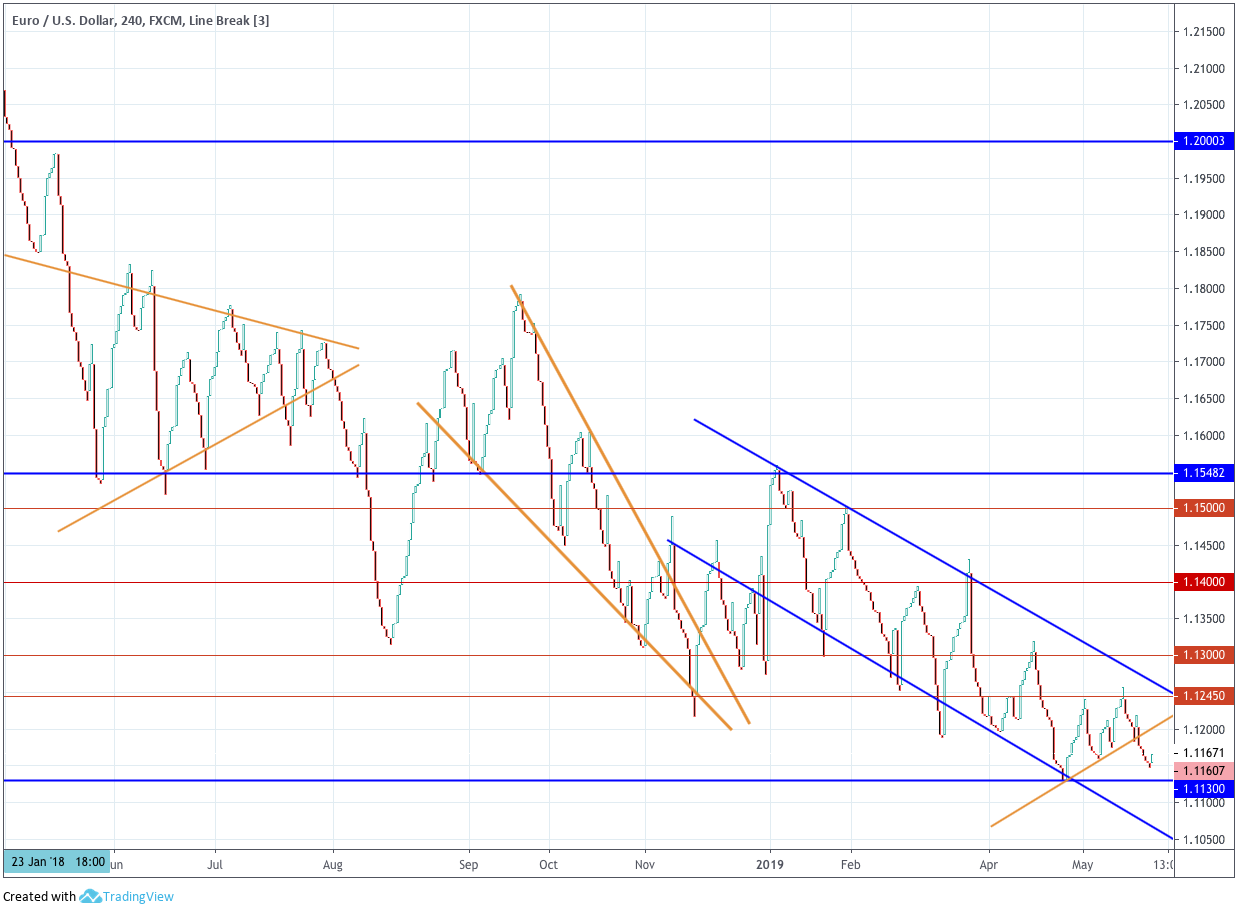
Chart 9 - Using trendlines and support/Resistance levels with Three-Line Break charts
Other Break Charts
We can adjust the sensitivity of the break by changing the levels to break. The Three-line break requires the break of three levels; a Two-Line break only two, and a Four-line break four.
According to Steve Nison, two line breaks can be used in shorter time-frame, while longer timeframes would require larger breaks. Not from a technical perspective, but from the goals of the trader or investor. He says an investor could use up to six lines to make decisions, while a daytrader may require faster action to catch most of the price movement. The Charting packages allow this change with ease. Charts 10 and 11 below shows a 2-line break and a 4-line break on the EURUSD 4H chart. We can observe that the 4-line break chart shows fewer retracements and oscillations than the 2-line break.
As it happens with other trading strategies, it is advisable to backtest the profitability of the N-line break charts before risking real money.
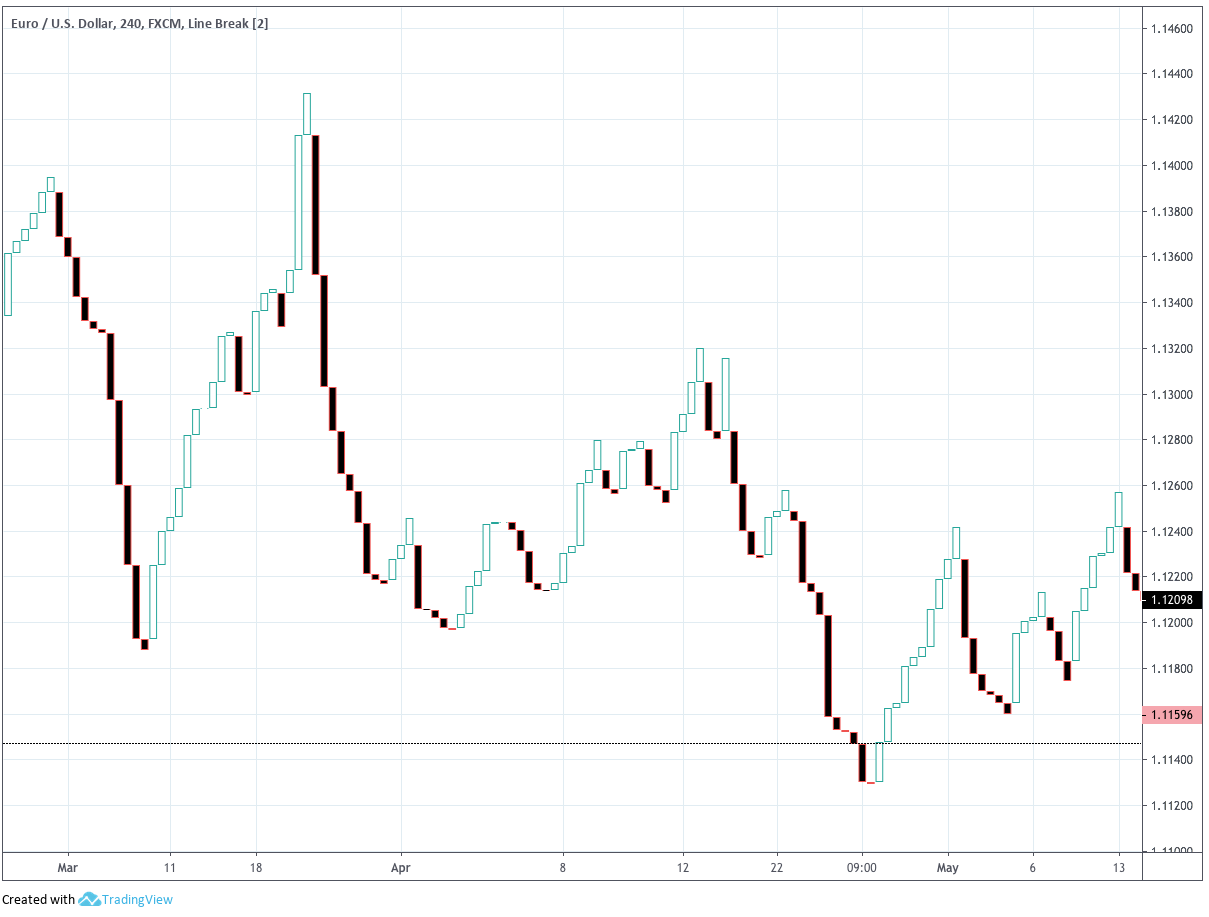
Chart 10 - EURUSD Two-Line Break
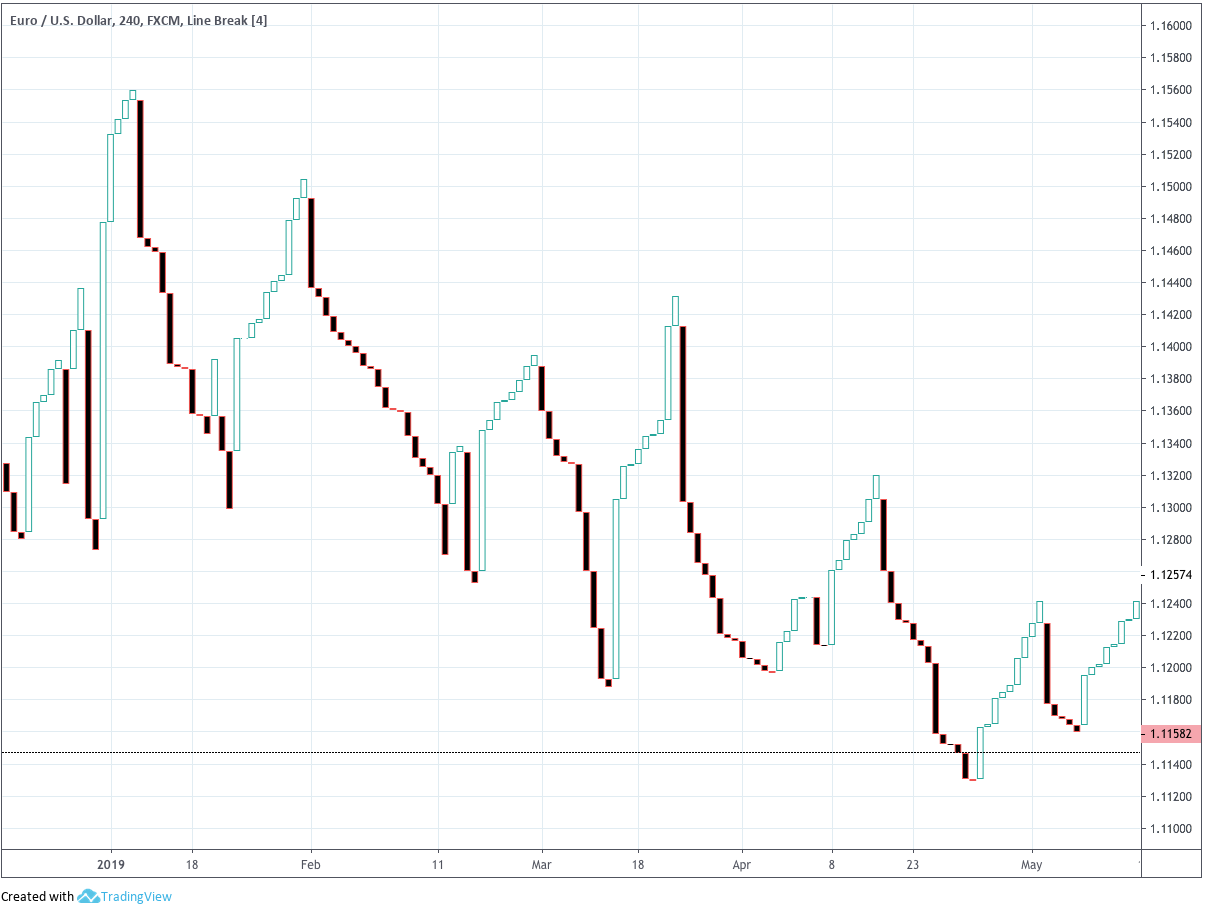
Chart 11 - EURUSD Three-Line Break
Conclusions and Takeaways
The Tree-line Break is a complete trading method, but it requires strong discipline to the trader. It can be performed using regular charts, but it seems more logical and easy to use it together with Three-line Break Charts.
Similarly to the Renko charts, the Three-line chart cleans out the nose of the price action, but instead of a fix-sized block on this case the height of the block a new high close.
Reversal signals happen when a block engulfs 3 previous blocks of a different colour.
This charts can be used to assess the trend while using a regular chart to take the entries.
Trend lines, supports/resistances and charting figures such as double tops or bottoms can be used on them
We can change the break size parameter to create similar charts for different purposes.
It is recommended to do backtests before trading using real money.
References:
Steve Nison: Beyond Candlesticks.
The Undergroundtrader.com Guide to Electronic Trading, Jea Yu
