

Linear Regression Indicator (LRI)
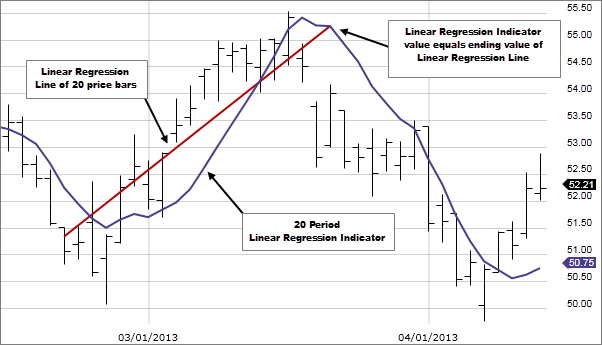
Linear Regression Indicator helps us in identifying new trends. It is similar to moving averages. LRI should not be confused with the Linear Regression lines, which are straight lines fitted to a series of data points.
The Linear Regression Indicator plots the endpoints of a whole series of linear regression lines drawn on consecutive days. LRI is a projection of tomorrow’s price, which is plotted today on the chart. The linear regression line hints to where the price would be expected, which makes the indicator more responsive than a moving average.
If the price of a currency is higher or lower as compared to the forecast value, traders anticipation is that the prices will return to more realistic levels. This indicator highlights where the price should be trading on a statistical basis. LRI has an advantage over a moving average as it has less lag than the moving average, and it responds rapidly to price changes.
LRI identifies the trend by calculating a Linear Regression Trend line, using the least-squares fit method, which helps to reduce the distance between the linear regression and data points. Trading signals should be taken by using the direction of the Linear Regression Indicator.
A long entry (or an exit from short position) should be made when the indicator turns to the upside. A short entry (or an exit from an extended position) should be made when the indicator turns to the downside.
Linear Regression IndicatorFormula
LRI uses the sum of least squares method to find a straight line that best fits data for the selected period. The endpoint of the line is plotted and the process is repeated for each succeeding day.
Sum Of Least Squares
This method provides an impartial measure of comparing different straight lines and finds that one line which fits the selected data.
- Plot each data point in a table.
- Then, calculate the distance between each data point and the proposed straight line
- Square the distances, this helps us in removing the negative values.
- Calculate the sum of the squares
- Steps 2 to 4 should be repeated for all the possible lines
- Then select the line with the lowest sum of squares (from step 4).
Example
| Date | n | Closing Price | Price = 20.50 + 0.11*n | Distance | Squared |
| 22-April | 1 | 20.55 | 20.61 | -0.06 | 0.0036 |
| 23-April | 2 | 20.80 | 20.72 | 0.08 | 0.0064 |
| 24-April | 3 | 20.95 | 20.83 | 0.12 | 0.0144 |
| 25-April | 4 | 20.78 | 20.94 | -0.16 | 0.0256 |
| 26-April | 5 | 21.10 | 21.05 | 0.05 | 0.0025 |
| Sum | 0.0525 |
Mathematical Formula
As it takes time to manually compute the sum of squares for each possible line, mathematicians have found a quicker way to do it.
We all know the formula for a straight line is y = a + b (a is the constant and b is the slope of the line)
The line of best fit is
LR = ( Σy - bΣx ) / n + ( nΣxy - ΣxΣy ) / ( nΣx²- (Σx)²)
y = price
x = date
n is the number of data points selected
Step by step process of Installing Linear Regression Indicator.
LRI indicator is not available in the MT4 terminal by default, but you can download the indicator from the internet.
Download the Linear Regression indicator. You can follow the below link for the same.
https://www.mql5.com/en/code/8200
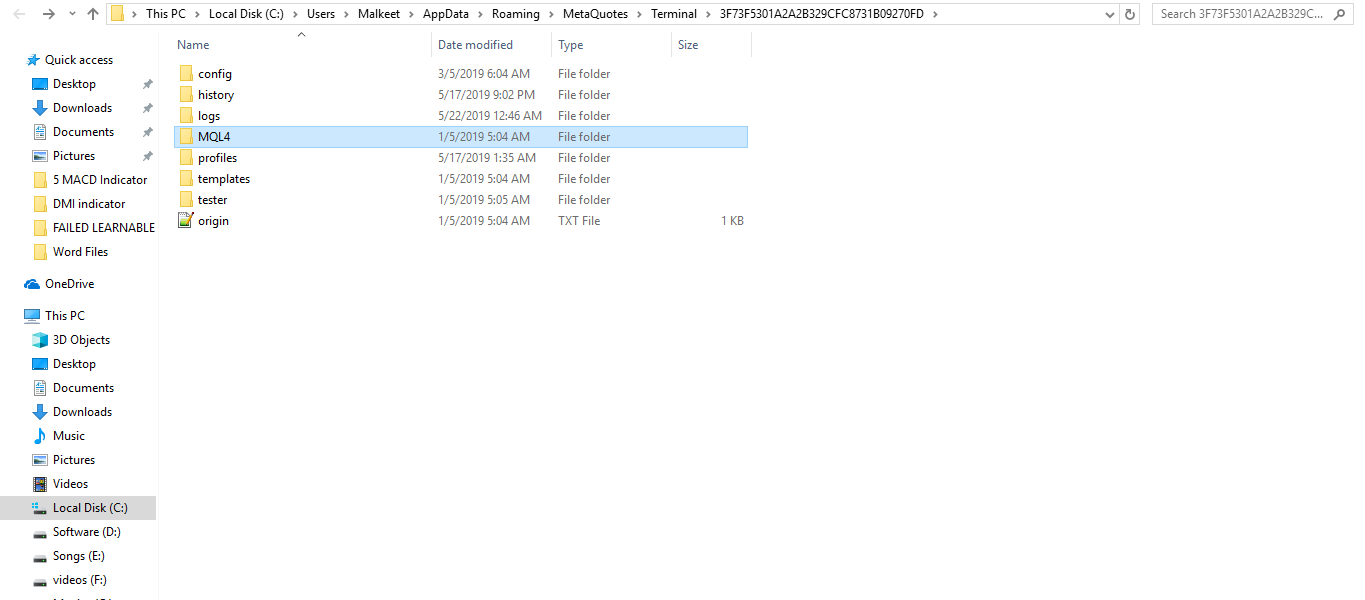
Copy the LRI to your MT4 directory/MQL4 (click on the image to magnify)
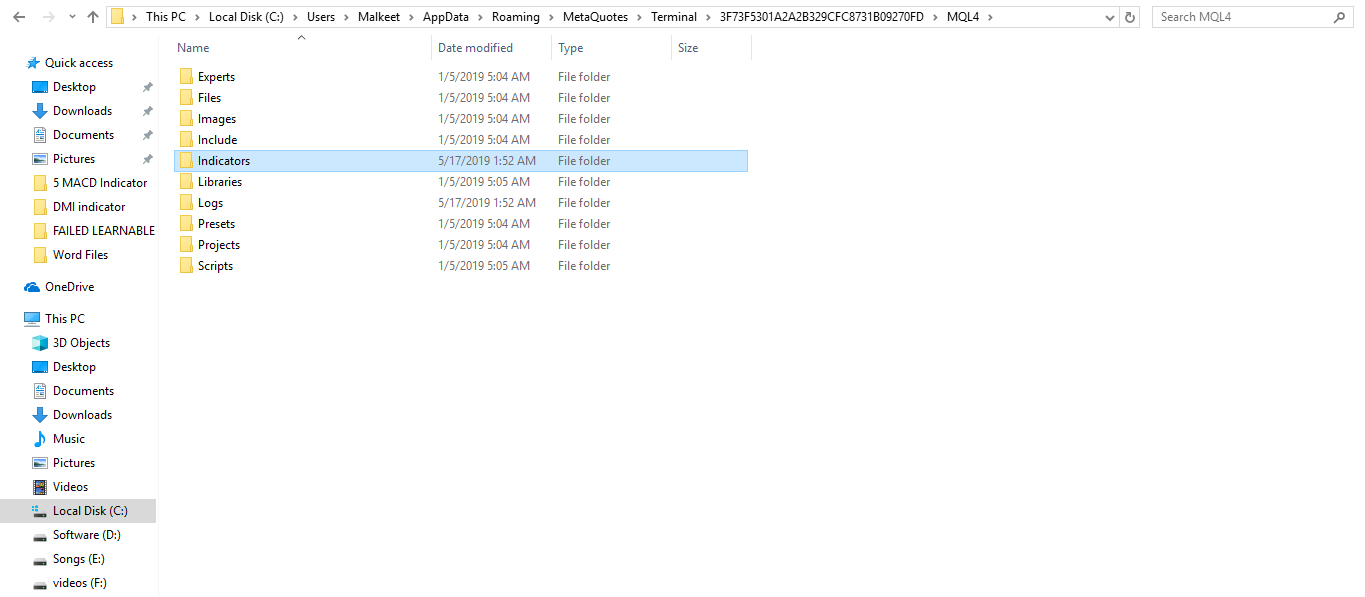
Click on indicators and paste here. (click on the image to magnify)
Restart your MT4 terminal.
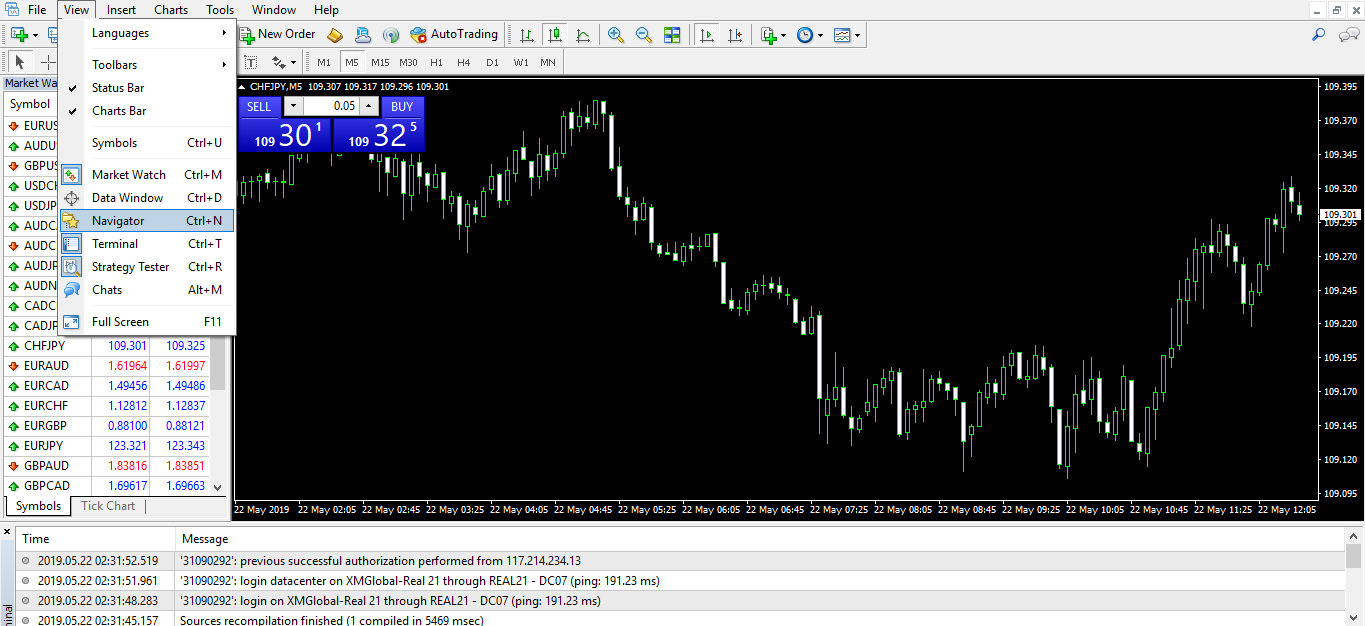
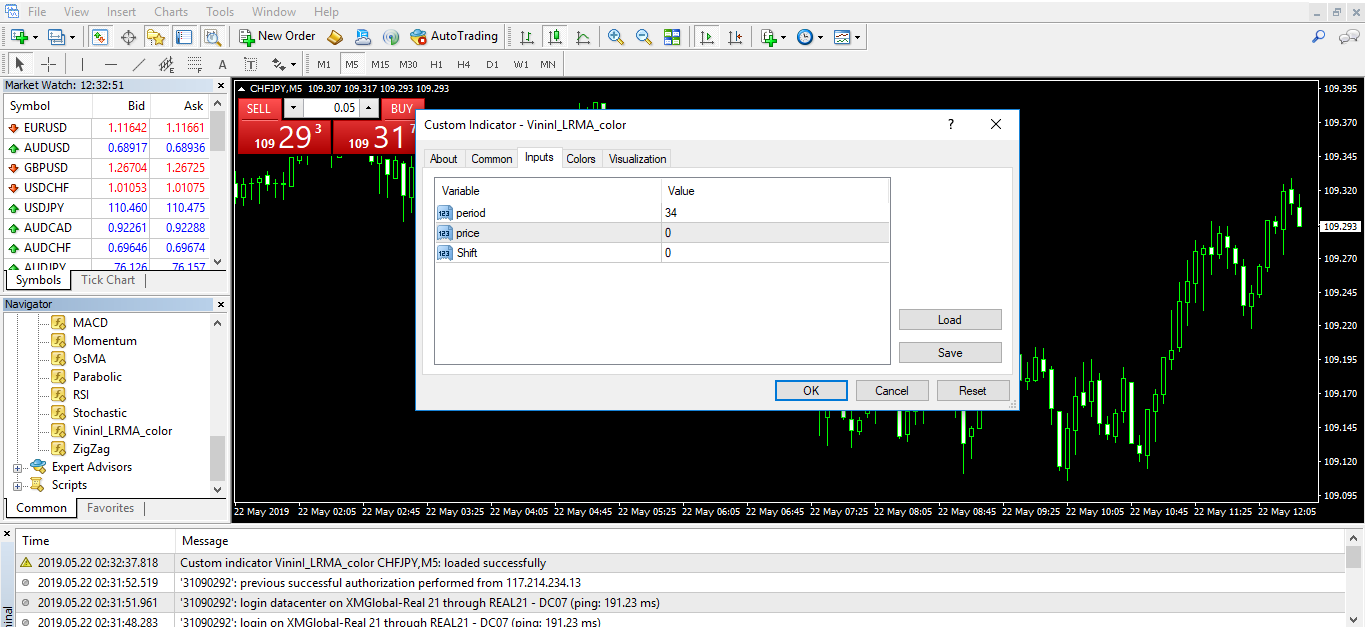
Search “Custom Indicators” in the MT4 navigator; it is available on the left side of the MT4. (click on the image to magnify)
Right-click on Linear Regression Indicator.
If you want to modify the settings, you can modify it, but it is recommended go with the default settings.
Click Ok.
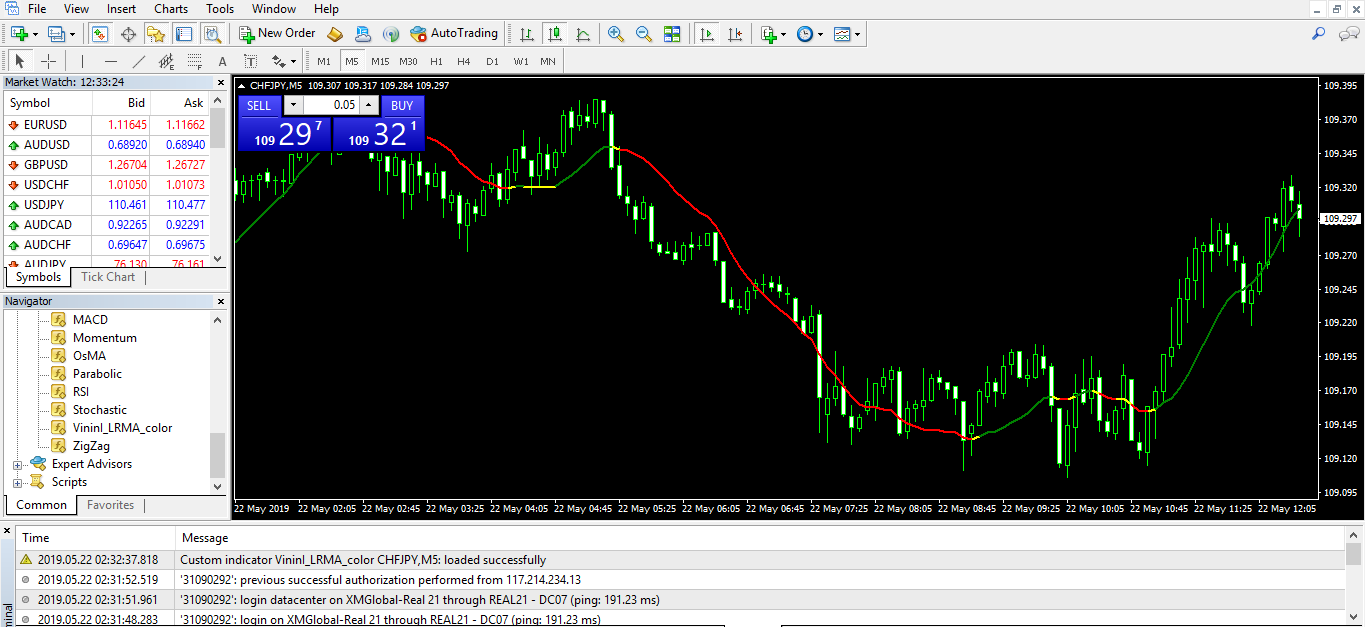
The indicator will then show up on your chart.(click on the image to magnify)
You can see the LRI indicator plotted on the below image of the CHFJPY chart below (click on the image to magnify).
LRI Indicator - Trading Strategy
LRI is most useful during the strong trend. It also gives the crossover signal in the market. Traders go long when the Linear Regression Indicator turns up, and they go short when this indicator turns down.
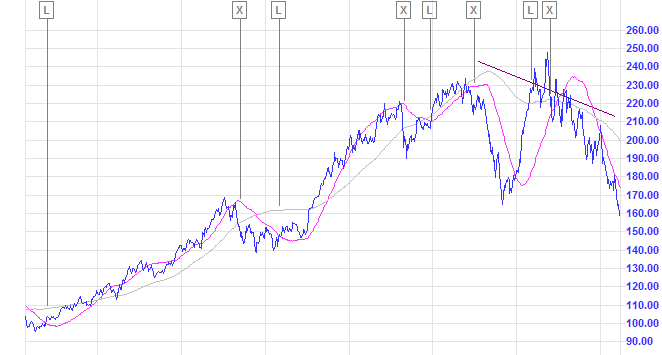
In the below example, we use100-day linear regression indicator and 300-day linear regression indicator, for the trend filter.
When the prices cross above the 100-day Linear Regression Indicator, and if you see the 300-day linear regression indicator rising at the same time, you can go for a buy trade and exit the trade when the 100-day LRI turns down. You can also take the buy when the 300-day linear regression indicator turns upward, and the 100-day LRI cross above the price.
When we combine the two different periods of Linear Regression Indicator, it gives us the divergence on the indicator, which is a significant sign of trend reversal. You can see the major trend reversal when we get the bearish divergence on the below chart. (click on it to magnify)
Conclusion
The Linear Regression Indicator is a powerful tool in identifying trends, and it can be applied to any markets and any time frame of your choice.
It is a purely math-based technical indicator that can be compared to moving averages, but it has way too less lag than the moving average. Because of this advantage, traders use this indicator alone to trade the markets.
It is advisable to combine LRI with another different period linear regression indicator as it helps you in providing more accurate signals.
The thumb rule is to remember it is a buy signal when the LRI points upwards or is crossed up by the price or another shorter LRI, and it is a sell signal when the LRI points downwards and the price or another shorter LRI moves below it.
Also, the change of slope of the LRI from downwards to upwards signal the end of the bearish leg. Conversely, the change in direction to the downside usually signals the end of the bullish trend. This happens with Periods above 20 bars.
No indicators can be used standalone. Hence it is recommended to use LRI with other tools like other indicators and Price Action to get more accurate entry and exits.
