

ETHUSD produced a Hammer yesterday on the Daily chart. The price had a bounce from a level where it had bounced earlier as well. Considering all the equations, it is very evident that the battle between intraday buyers and sellers has been very interesting on ETHUSD. The price has to come out from the range to show its next direction.
Thus, ETHUSD traders must watch the chart carefully because the next breakout is going to be vital, which may determine ETHUSD’s direction for some weeks.
Let us have a look at the Daily-ETHUSD first.
The Daily Chart
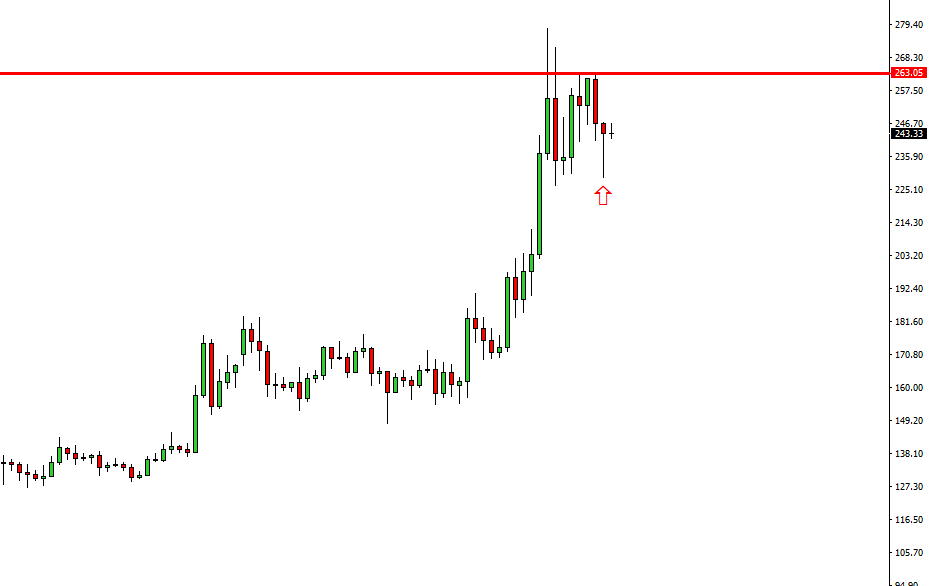
The arrowed candle was yesterday’s daily candle. The price did travel to the South on its intraday charts. However, a strong bounce at the end made the candle be a Hammer.
This is significant since the bounce was from the level which has been a strong level of support where the price had reacted earlier on a number of occasions. The H4 traders seem to be very engaged in this too. Let us have a look at the H4 chart; the chart might explain it better.
The H4 Chart
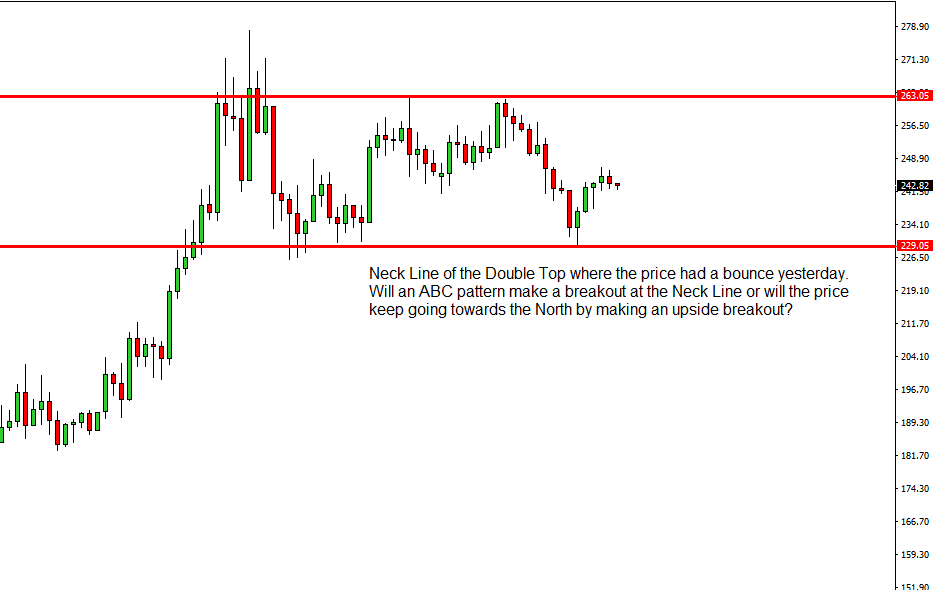
The H4 chart shows that the level of 229.05 has become the level of support here. Before coming to this level, the price made a breakout at the level of 241.40. That level was a neckline level of a double top too. However, sellers were not confident enough to take the price further down.
The price then has started having a correction. This may keep going towards the upside or it may come down after making an ABC pattern here. The question will be answered once the price comes out from the range by making either an upside breakout or a downside breakout.
Meanwhile, the daily traders have to keep their eyes on ETHUSD’s intraday movements as well as the movement on the H4 chart closely to get ideas of its next direction.
