

Directional Movement Index (DMI)
DMI is a part of the series of technical indicators developed by Welles Wilder. A lot of trading platforms in the industry split this indicator into two. ADX (Average Directional Index) as one indicator and Directional Movement as other. Typically, these two indicators are combined to form the DMI, and it oscillates between 0 and 100.
The Directional Movement shows the downside or upside movement of the market and the ADX show the strength of that movement. The usage of DMI and how this indicator can help you in making trading decisions are discussed below.
What does the Directional Movement Index do?
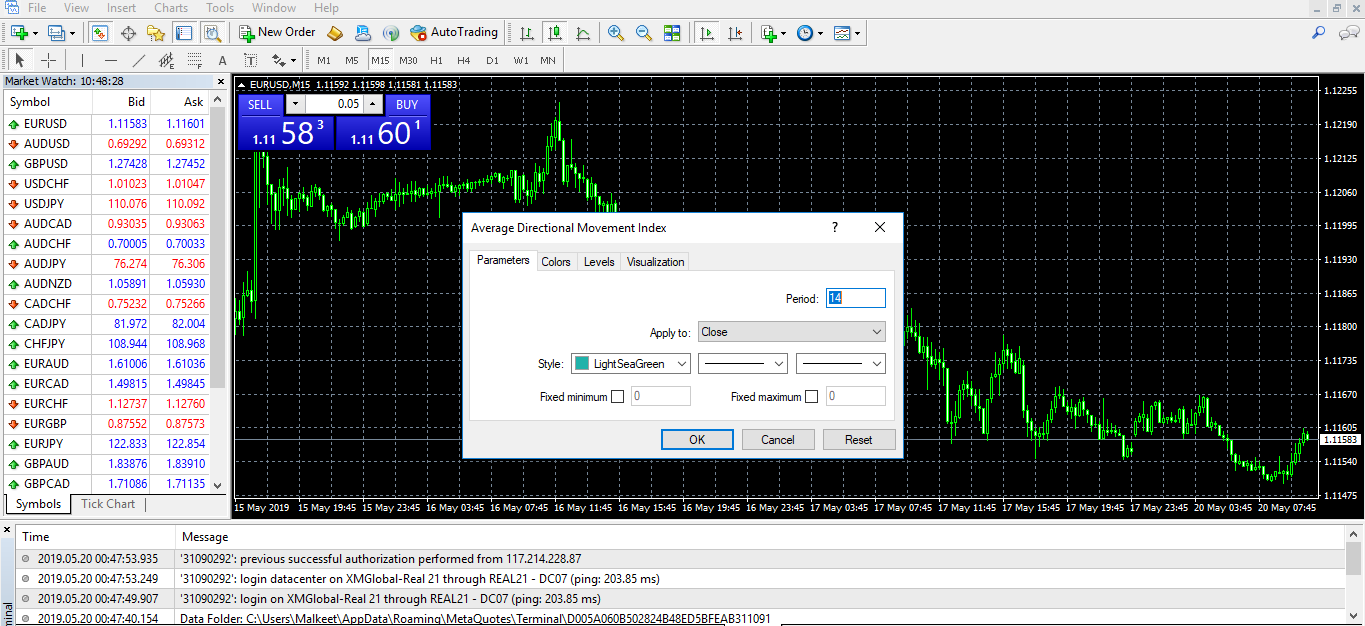
When you first load up the Directional Movement Index onto your charts, it will ask you for the input period value used for its internal calculations. The input value determines how many periods are employed in the Directional Movement Index calculations.
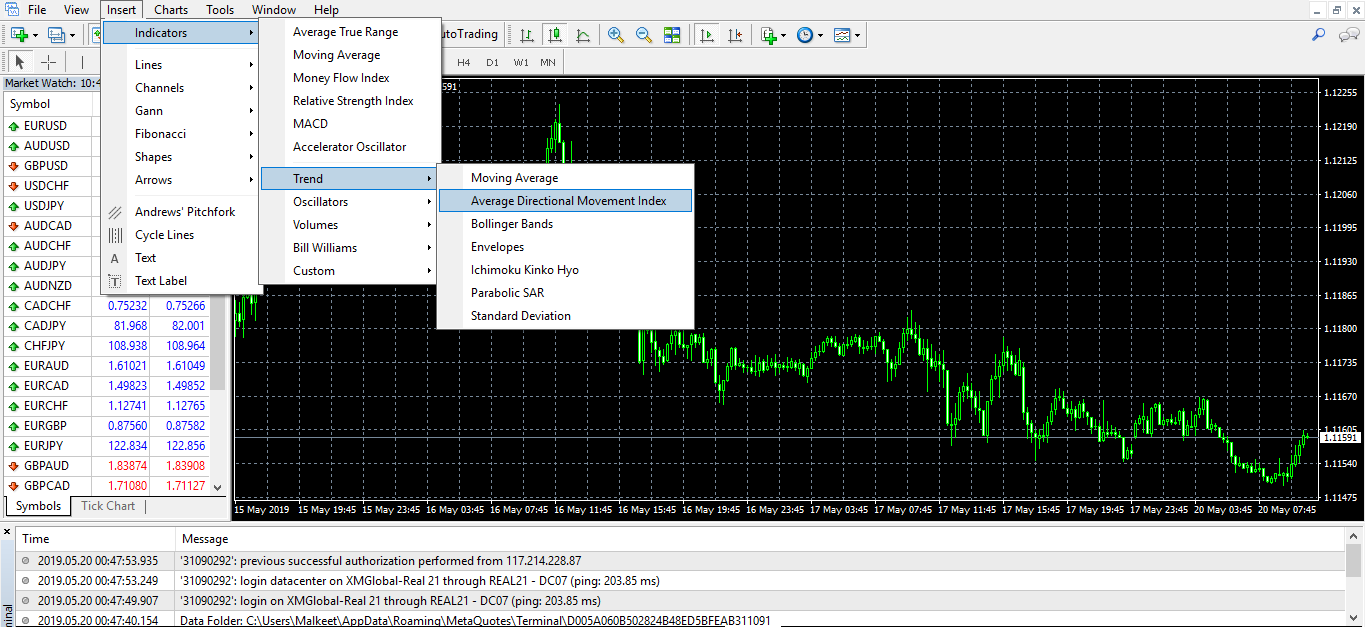
The default is 14. Once the indicator accepts your input parameter, it proceeds to open up the indicator window at the bottom of the price chart. To set up this indicator in MT4, click, Insert > Indicators > Trend > click on Average Directional Movement Index.
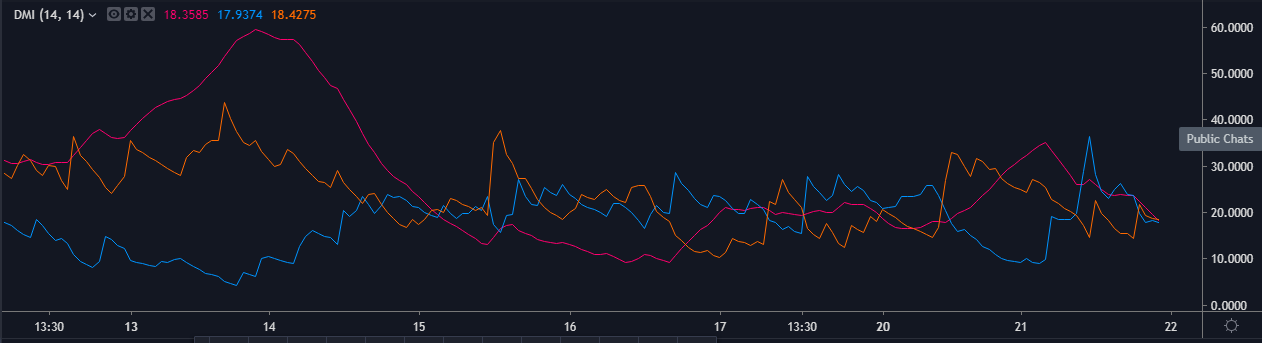
The indicator forms two lines (+DI & -DI), comparing the prior high and low of a currency. The positive directional movement line is designed as +DI and a negative directional movement line is named -DI. The +DI values are represented by the green line and -DI by the red line. The indicator ranges between 0-100 and is designed to quantify trend strength. The +D1line indicates the upward pressure in the market, and the –D1 line indicates the downward pressure.
The crossovers are the main signals that DMI generates. When the +D1 crosses above the –D1 it indicates the buy signal, and when the –D1 drops below the +D1, the sell trade is initiated.
DMI FORMULA
The entire indicator and the corresponding values are calculated by the trading tool itself. But we want you to have a basic understanding of how these values are derived, so below is the formula of DMI
DM – Directional Movement |
The +DM, -DM and TR are each accumulated and smoothed using a custom smoothing method. For an n period smoothing, 1/n of each period’s value is added to the total each period, similar to an exponential smoothing:
+DM= (+DM-1 - (+DM -1 / n)) + (+DM)
-DM= (-DM-1 - (-DM-1 / n)) + (-DM)
TR= (TR-1 - (TR-1 / n)) + (TR)
The True Range (TR) is calculated for each period, where:
TR = Max of (High - Low), (High –Previous Close), (Previous Close - Low)
Compute the positive/negative Directional Indexes, +DI and -DI, as a percentage of the True Range: +DI = (+DM/TR) * 100 and-DI = (-DM/TR) * 100
DMI STRATEGY
There are a bunch of DMI strategies traders use to get trading signals. Follow this step-by-step process to understand the best way to generate signals using this indicator.
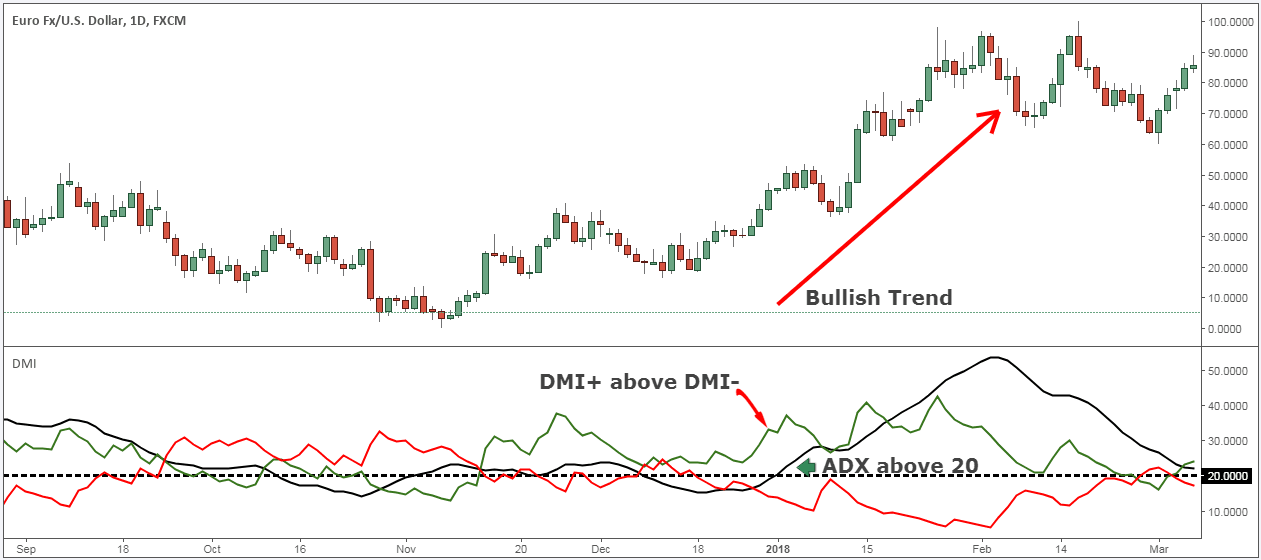
Step 1– (Buy Example) We are going to use multiple timeframes to discover the best signals. Confirm the trend on the daily chart, the DMI+ line should be above the DMI- line, and the ADX line needs to pass above 20 levels.
As you can see in the image below, the EURUSD daily trend was up, and DMI+ was also above the DMI- line.
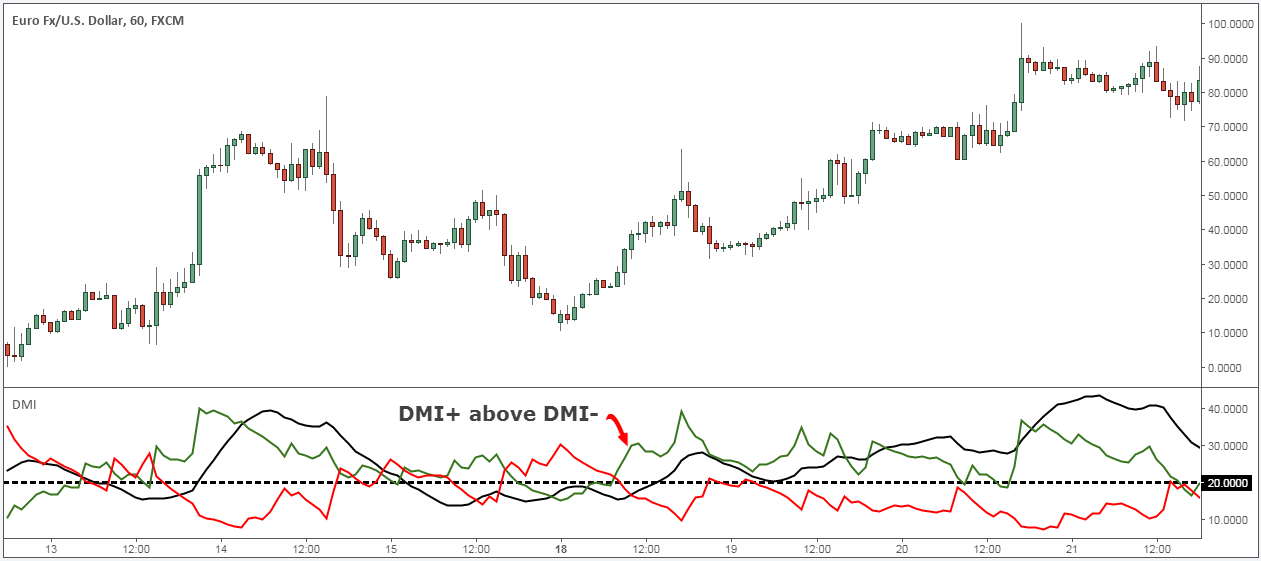
Step 2– Since we know that our daily timeframe is in an uptrend, we also need our 60-min timeframe to be in an uptrend. Then on the 60-min chart, wait until the DMI+ line breaks above the DMI- line to signal a bullish trend. (Refer to the image below)
Step 3– In this step, we need to confirm if the ADX line is above 20 levels. This implies the trend is strong enough and will continue to move up. Since both of our timeframes are aligned with each other, the buy signal happens when the ADX line breaks above the 20 levels.
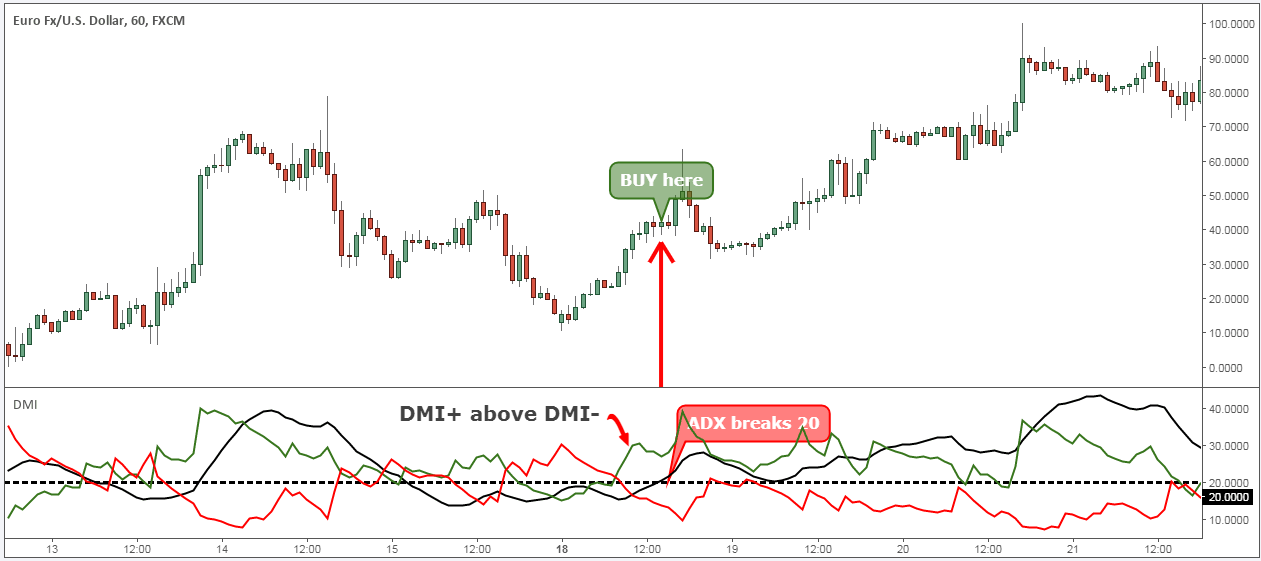
In the image below, the DMI+ line is above the DMI- line, and when the ADX line breaks above the 20 levels, it is a strong buy signal.
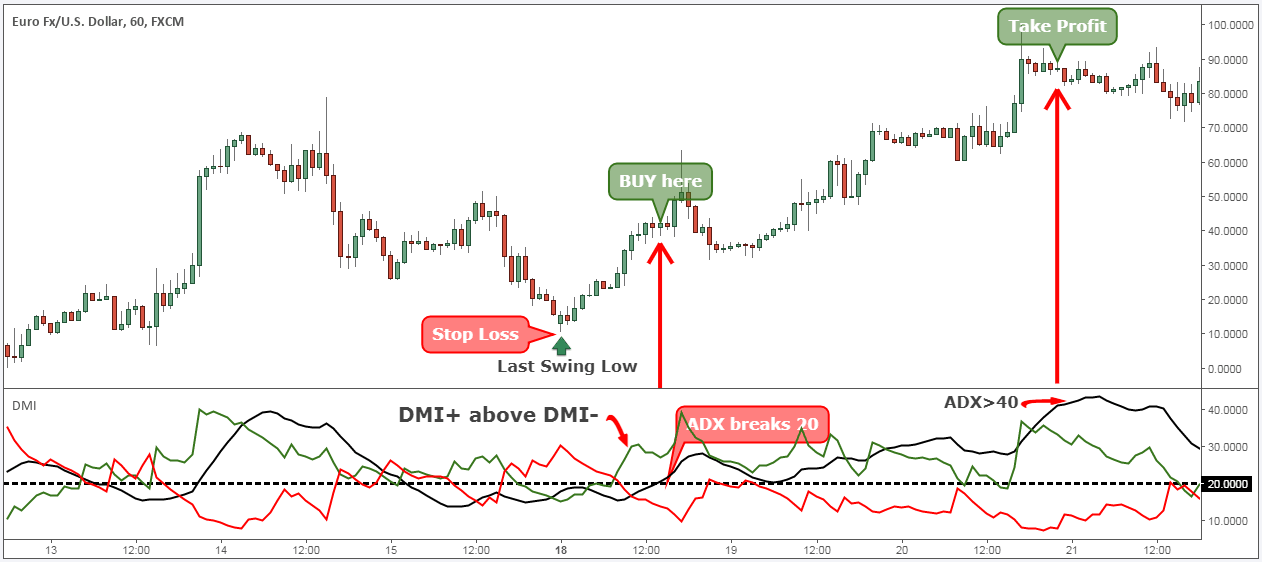
Step 4- When the ADX line hits the 40 levels, it is a sign of an overextended trend, and the trend is expected to lose its buying momentum. Hence, it is considered as an excellent area to book your profits. ADX is a good filter that identifies the losing momentum of the trends, thereby helping traders to take prior actions.
Conclusion
The DMI indicator is essentially a combination of two basic indicators. They are Directional Movement lines (-DI and +DI) and the ADX.
The primary objective of a trader is to identify the direction of the trend. Thumb rule is to remember the position of +DI & -DI lines. When +DI is above –DI, it means the trend is bullish. When -DI is above +DI, it means the trend is bearish.
DMI will help you in finding the trend direction, and the ADX line shows you the strength of the trend, making them a perfect combination.
Do not forget the readings of the ADX line. If its reading is above 20, it means the trend is strong and any reading below 20 means the trend is not clear.
