
ETHUSD produced a good-looking bullish candle on the daily chart yesterday. However, the price is still within the resistance, which would make the daily traders wait to get a breakout towards the upside. On the day before yesterday, the daily candle came out as a spinning top with a bearish body.
Thus, it was assumed that yesterday’s candle would come out as a bullish candle. As per the assumption, the daily candle came out as a bullish candle. However, since there has not been any breakout towards the North, ETHUSD buyers do not have any other option but to wait as far as the ETHUSD daily chart is concerned.
Let us have a look at the ETHUSD-Daily Chart
The Daily Chart
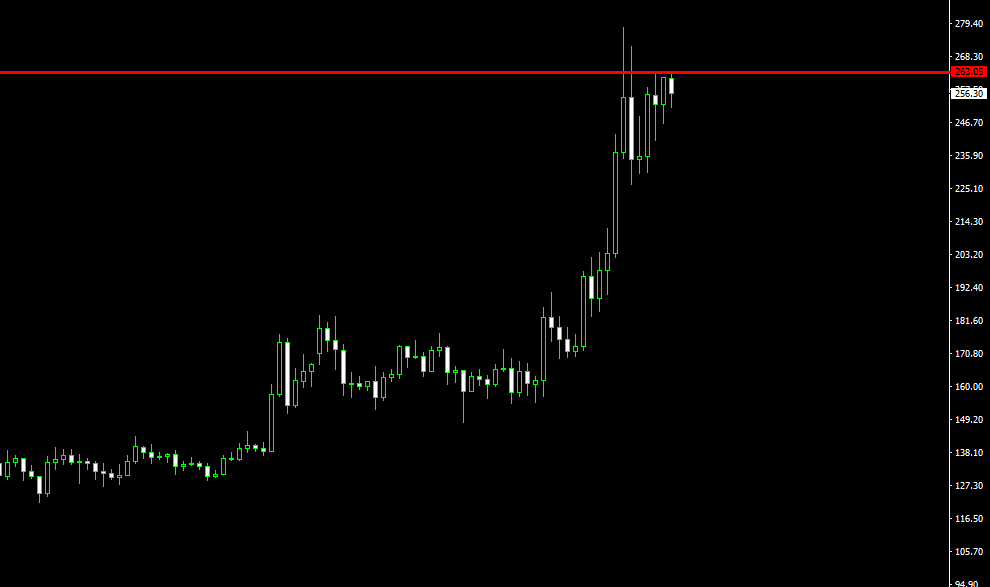
The last candle is today’s candle. Have a look at the candle one before that. A solid bullish candle covered the bearish body of the previous candle. However, the level of 263.05 was not breached. Instead, it was held by the daily candles for a number of times.
This level has become an important factor for the daily ETHUSD traders. Unless the level gets broken by a daily candle, buyers of ETHUSD have the option to watch only.
Let us flip over to the H4-ETHUSD chart
The H4 Chart
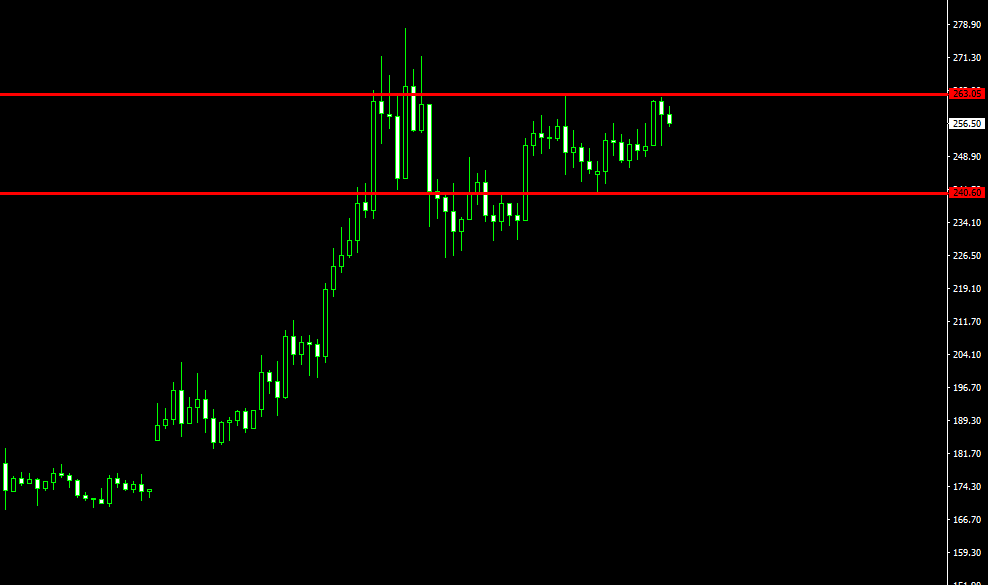
The H4 chart shows that the level of 263.05 has been held by the H4 candles on many occasions. Moreover, it produced some bearish reversal candles. These are signs of an upcoming bearish movement.
The level of 240.60 is going to be a factor here, though. The level of 240.60 has to be breached by an H4 bearish candle for the price to go towards the South. If that happens today, this might produce a good-looking bearish daily candle.
An engulfing bearish daily candle around the resistance area may change the overall view of the traders on ETHUSD. Thus, daily traders must be eagerly waiting to see the next outcome to find a direction on ETHUSD.