

Buy or Sell That is the Question
Traders basically use two approaches to address the market action, even when trading with the primary trend.
The more common strategy during bullish trends, traders buy weakness and sell strength and sell strength and buy weakness during downtrends. This is what is called the “buy low sell high” philosophy. But there is a second approach to doing business: The buy high and sell higher way.

The first methodology is for a smart and lone ranger. He sees a tasty piece of cheese, and want to be the first mouse to catch it. But maybe he’s just getting caught in a trap. He might become the victim of his audacity.
The second methodology is for careful people who like to ride the wave. It means you are part of a crowd of mousses that take the cheese after a bunch of pioneer rats took it, and it was confirmed that it wasn’t a trap.
Here we are going to talk about this second way of doing business. And it is called Momentum Trading.
Momentum
Then, what is Momentum, and why is different from other indicators?
Momentum gives a measure of the change rate in price in an interval. Momentum is a relationship between a price difference and the time it takes to achieve it. It measures the speed of price change.
If we imagine a ball thrown up vertically, we can see that its speed is declining as it moves up until it stops and starts falling. If we measure the elevation covered every second, we could observe that the amount is decreasing second after second until it stops in mid-air.
The math formula for Momentum is:
Momentum = Price (0) - Price(n)
Where n is the price n bars earlier. Therefore, Momentum is an indicator of the speed of the price.
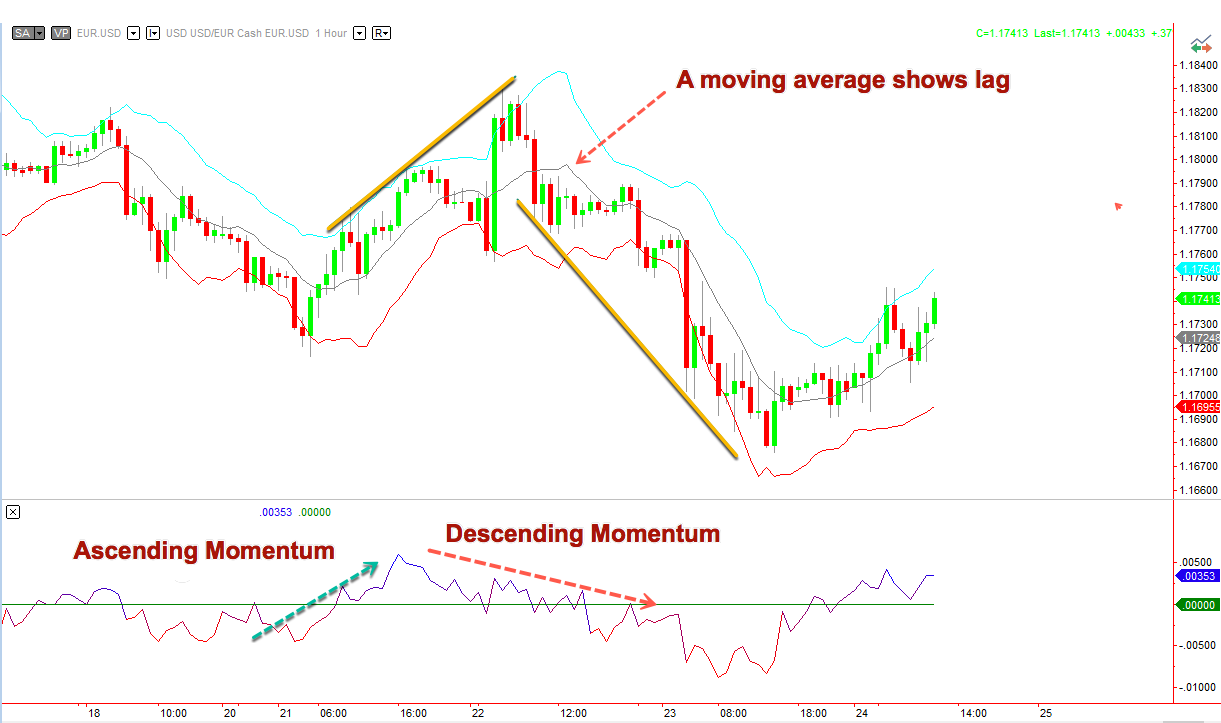 Chart 1 - EURUSD 1h with the Momentum Indicator. Click on the chart to enlarge
Understanding Momentum
The most extraordinary aspect of the Momentum Indicator is that it doesn’t show delay. A Moving Average always turns down well after the market has topped. Momentum Show the market is peaking with no lag.
Momentum just answers the question of how high or low is price compared to n periods ago. This speed information tells when the market has put the brake.
Momentum as a leading indicator
Almost all technical indicators, such as a moving average of the price, must show lag. The larger its period, the greater the lag. On the MACD it could be reduced because it is a subtraction of two moving averages, but it still has some delay because one period is shorter than the other.
But Momentum is a direct subtraction of prices, its result is speed, which leads the movement. That implies speed should come before any movement can be produced. Therefore, Momentum leads the movement in the price.
Momentum as Overbought and Oversold indicator
Short-term distribution of prices shows a bell-shaped curve ( see the figure). We observe that the volume is maximal around the mean of this distribution, and the extremes behave as overbought and oversold zones. Near extremes, the price motion stops and bounce back towards the mean. The Momentum indicator shows this instant by pointing a sudden change in speed.
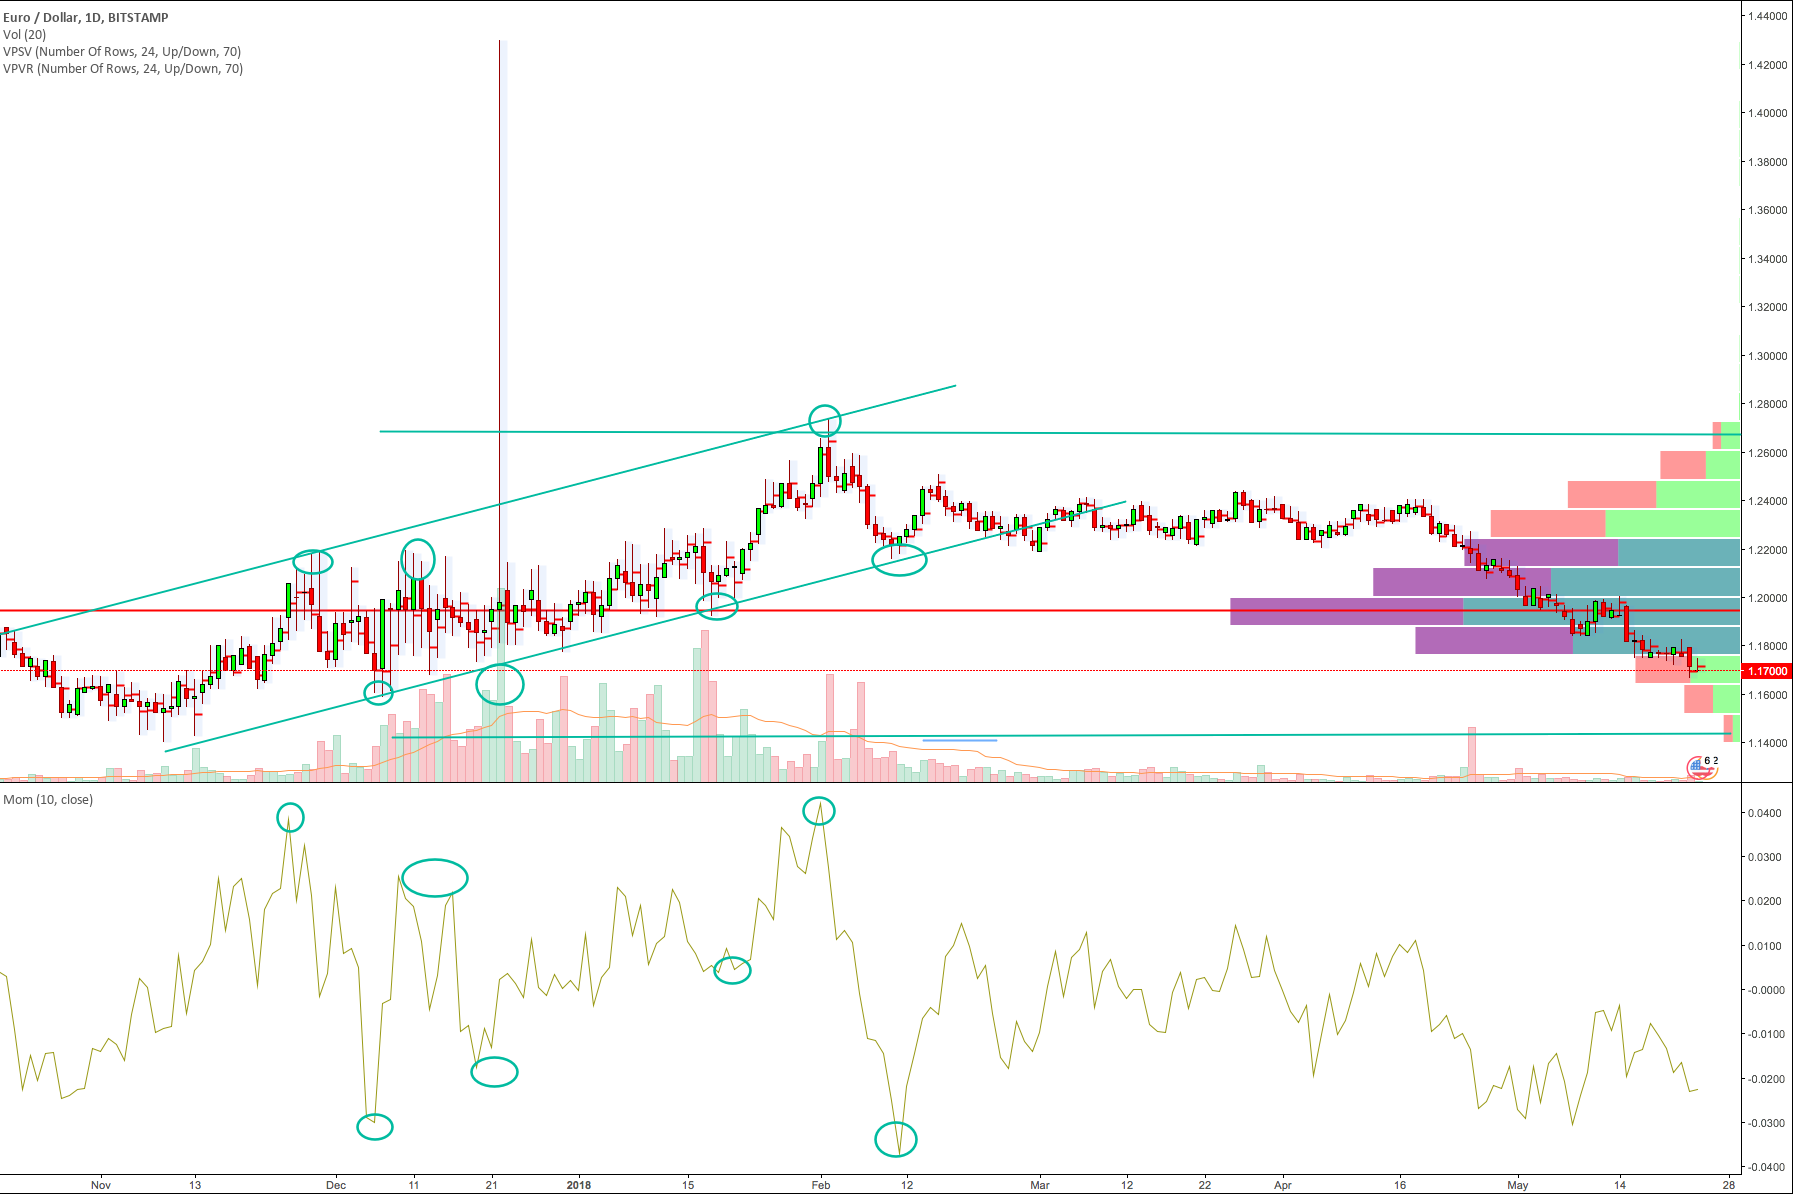
Chart 2 - EURUSD 1D and Momentum Indicator with Overbought and Oversold areas. Click on the chart to enlarge
Divergences
The Momentum Indicator is especially suited for divergence trading. When the price is creating new tops and Momentum is slowing down, it warns that the price movement is stopping and a correction is ready to show up. It can be a retracement or a simple sideways consolidation, but at least a pause in the trend can be expected.
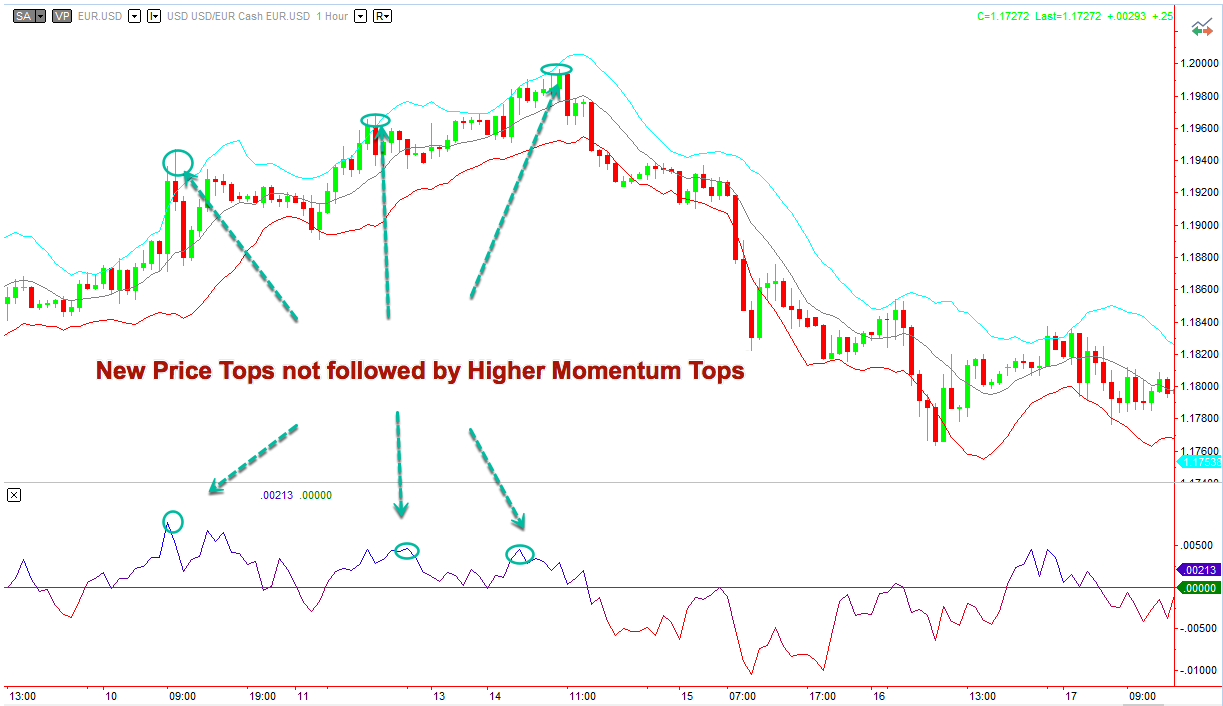
Chart 3 - EURUSD 1h and Momentum Indicator showing Divergences with price. Click on the chart to enlarge
It is important to note that divergences are just warning signs we must pay attention to, but not real trading signals.
Charts 1 and 3 created using Multicharts 12 (TM) Trading Workstation. Chart 3 created using TradingView on-line charting
