

BitcoinUSD after being bullish for a number of days, the price seems to have found a strong level of resistance. Yesterday’s daily candle came out as a strong bearish candle which almost engulfed the previous candle. Today’s price action so far has been bearish as well. Thus, Bitcoin Daily chart’s traders have to wait for the price to produce a daily bullish reversal to offer them long entries on BitcoinUSD. It could change the trend as well if it ends up producing a Double Top here. Only time can tell. Meanwhile, Daily BitcoinUSD traders have only to watch the chart.
The Daily BitcoinUSD Chart
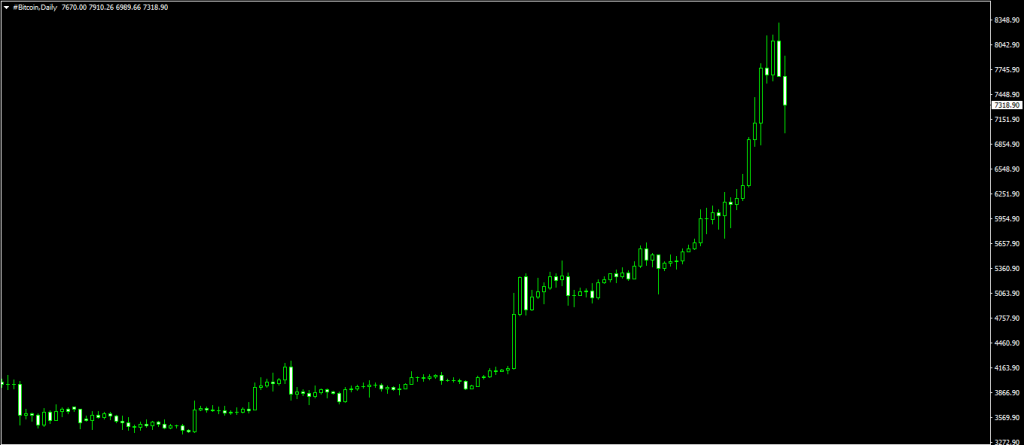 Yesterday’s daily candle came out as a Marubozu bearish candle. This candle is not exactly as powerful as an Engulfing bearish candle, but it is powerful enough to drive the price to other direction at least for a while. Today’s intraday price action suggests that the price has been bearish and intraday traders have been going short whenever they get the opportunities.
With BitcoinUSD, intraday trading is too risky since intraday charts produce long spikes every now and then. However, the H4 chart is consistent enough to offer entries. Let us have a look at the H4 BitcoinUSD chart.
The H4 BitcoinUSD Chart
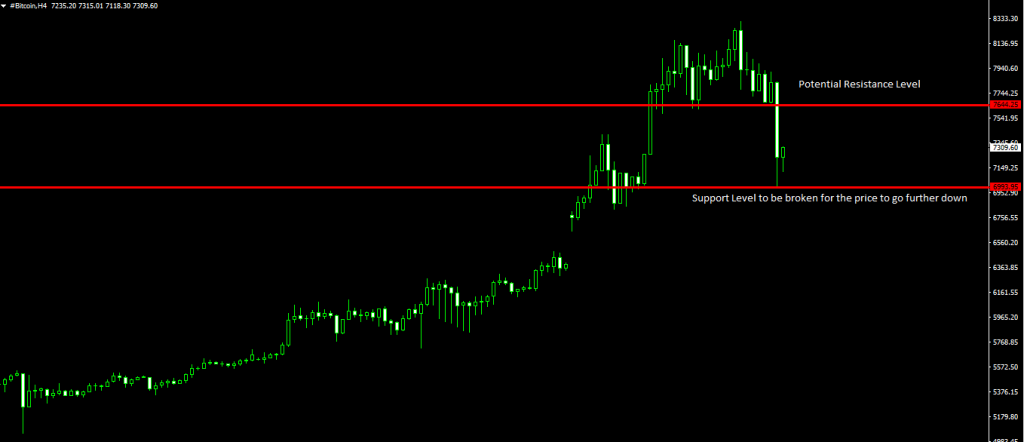
The H4 chart suggests that the level of 6993.95 is being held by the price as a support level. The price reacted to the level heavily earlier too. Now there is a possibility that the price goes back to the level of 7644.25. If that happens, and the level ends up producing an H4 bearish reversal candle such as an Engulfing or Marubozu Candle, then an H4 breakout at today’s lowest low would drive the price to go towards the level of 6170.70 with a good pace.
Summary of the trade
Entry: H4 breakout at 6993.95 after being held by the marked resistance level
Stop Loss: Above 7644.25
Take Profit: 6170.70
