

The Commodity Channel Index CCI
The Commodity Channel Index (CCI) is an oscillator indicator which was originally bought up by Donald Lambert in the year 1980. CCI is a technical indicator in the commodity market. It can be used on both equities and currencies.
Just like any other indicator, CCI predicts the upcoming bullishness or bearishness in the market. It resembles the momentum indicator, as the prediction here is based on the momentum of the market.
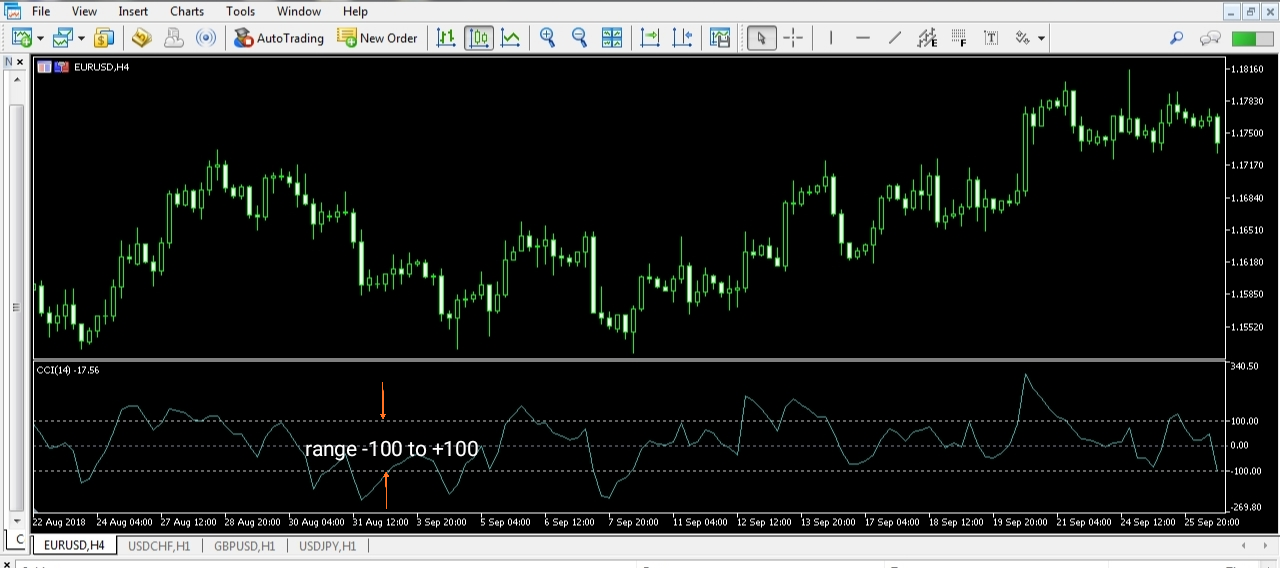
CCI works on the relative comparison of the present price to the past price movement. This indicator oscillates between the range -100 and +100. It has a zero line which lies in the centre of the bounded range. The range can be extended more than -100 to +100 too. But, -100 and +100 represent the key values.
Terminologies related to CCI
Typical price (T.P) is the average of the low, high, and closing prices for a given bar.
Formula to calculate T.P = (high + low + close) / 3
Simple Moving Average (SMA) is the average price line which is obtained, by adding the closing prices of the market for a given period and then dividing it by the number of periods.
Mean Absolute Deviation(MAD)of the given set of data prices is the average of their absolute deviations.
Calculation of Commodity Channel Index
The formula to calculate is
CCI = (1/0.015) * (T.P – SMA (T.P)) / MAD(T.P)
T.P- Typical Price
SMA (T.P)- Simple Moving Average of the Typical Price
MAD (T.P)- Mean Absolute Deviation of the Typical Price
We can see that the CCI is multiplied by a factor 1/0.015. This is Lambert’s constant. It was set to obtain most of the values of CCI inside the range -100 to +100. Therefore, 70-80% of the values of CCI lie within the above-mentioned range.
The percentage of CCI values that come under the range -100 to +100 depends on the number of periods. If the period chosen is small, then there will be a small percentage of values between -100 to +100. Contrarily, if the number of periods is more, than the percentage of values that fall between -100 to +100 will be quite high.
Interpretation
If the currency’s CCI value is high, we can say that there is demand for that currency in the market and if the value of CCI is low for a currency, we can say that there is supply in the market for that currency. The oscillation of CCI is above and below the zero line. And as previously said, most of the movement happens in the region -100 to +100.
The CCI also determines the oversold or overbought condition in the market. If the CCI line is above the +100 mark line, this indicates that the market is in the overbought region and similarly if the CCI line is below the -100 mark line, this is a sign that the market is oversold.
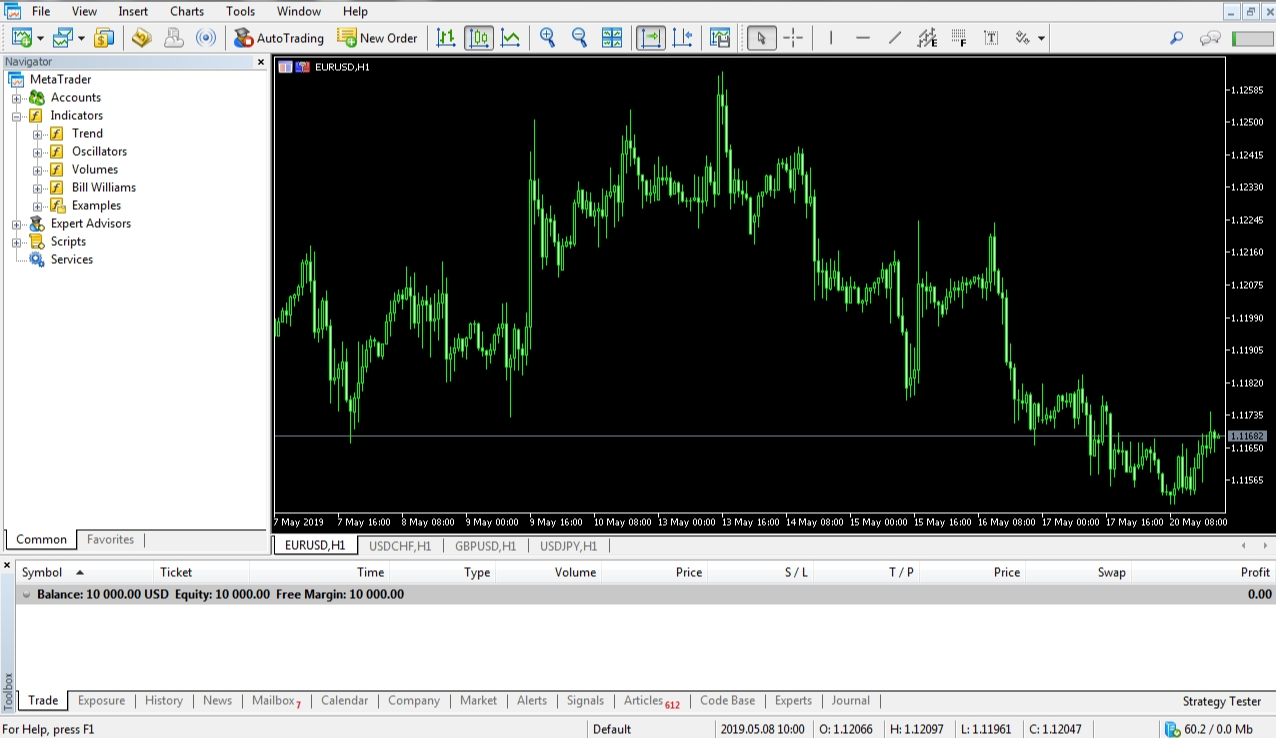
How to install CCI Indicator in MT4 (Step by step process)
Below is the main screen window of the MT4 trading platform.
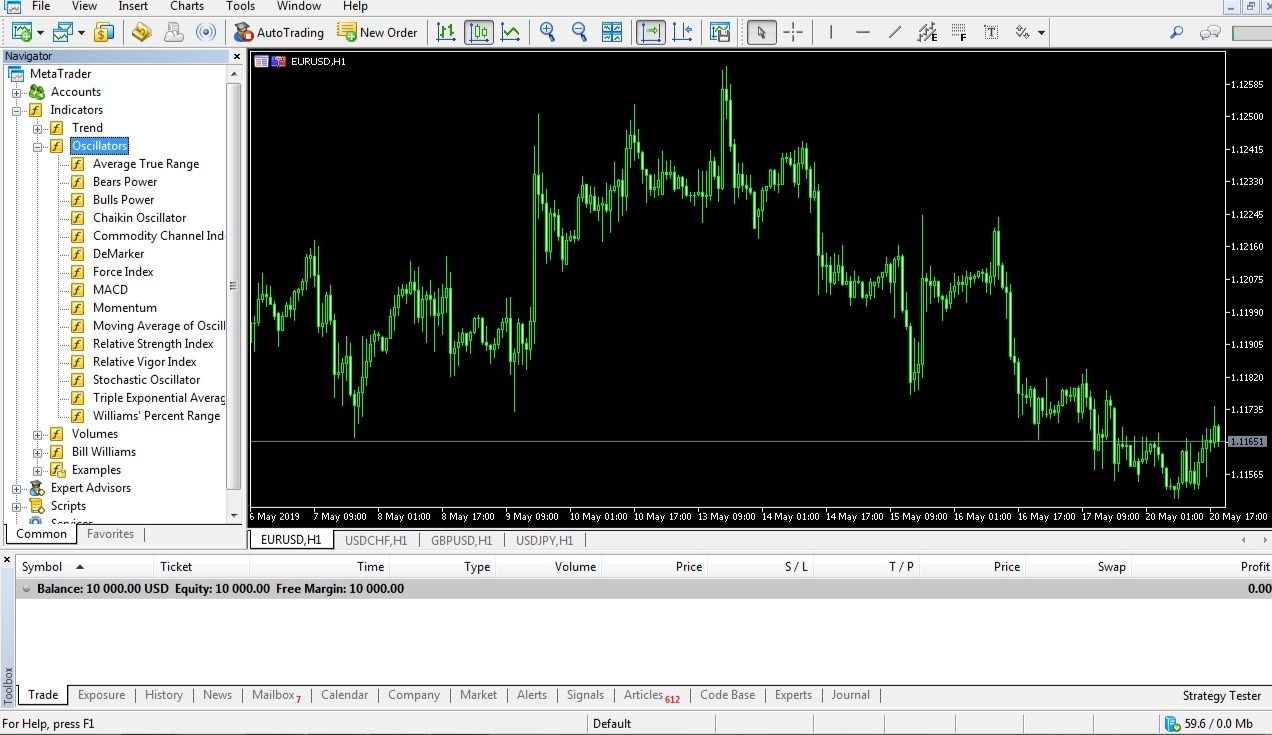
Step 1: From the navigator box, choose the “oscillators” option. This results in a dropdown list, which displays all the oscillator indicators.
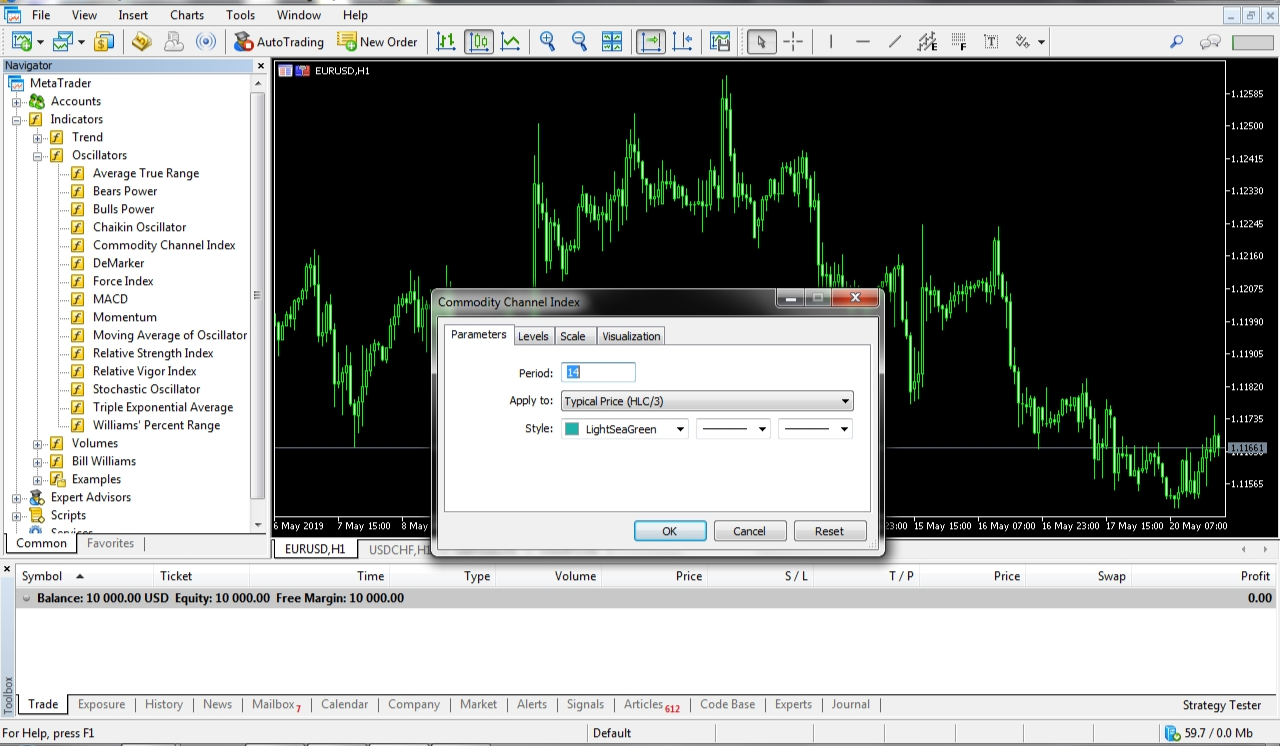
Step2: As we wish to discover the CCI indicator, hit the “Commodity Channel Index” option. A popup window will be opened, as shown below. You get to change the number of periods as per your requirement but the default number of periods is fixed to 14.
Step3: Finally, hit “ok” and you will be able to see the CCI indicator right below the price chart. Not to mention, the calculation is automated by the MT4 software.
It is advised to use the default setting provided by MT4 if you are new to trading. You can experiment on these settings later when you gain some experience.
CCI Indicator – Trading Strategies
Lambert’s strategy for predicting the upcoming trend in the market is quite simple. This strategy comes into play only when the CCI line breaches above the +100 mark or below the -100 mark. Therefore, this situation is seen only 20-30% of the time.
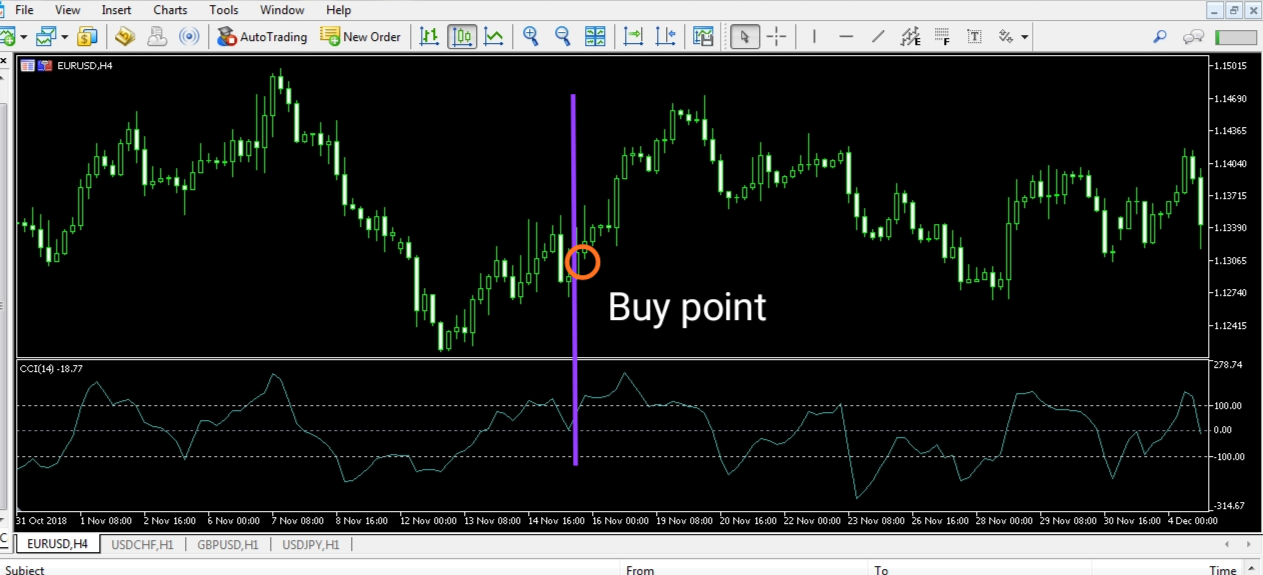
When the line goes above the +100 mark, this indicates a bullish move in the market which gives a buy signal. And this position should be closed when the line comes back below the +100 mark.
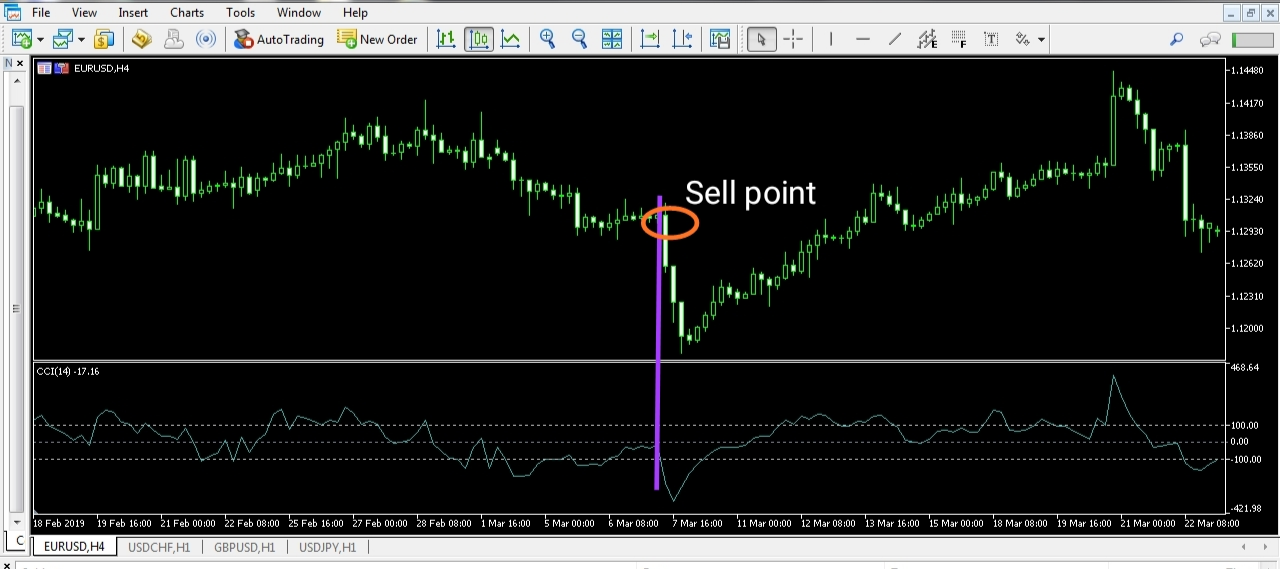
Conversely, if the line goes below the -100 mark, this indicates a bearish move in the market which signals for a sell. The sell position should be closed when the line moves up above the -100 mark.
Example (Buy): The purple line indicates the point when the CCI moves above the +100 line and the around the orange circle, buy can be initiated.
Example (Sell): Similar to the buy example, the purple line is the point where the CCI drops below the -100 range line and the orange circle indicates the selling point.
A refined strategy of the above can be implemented as:
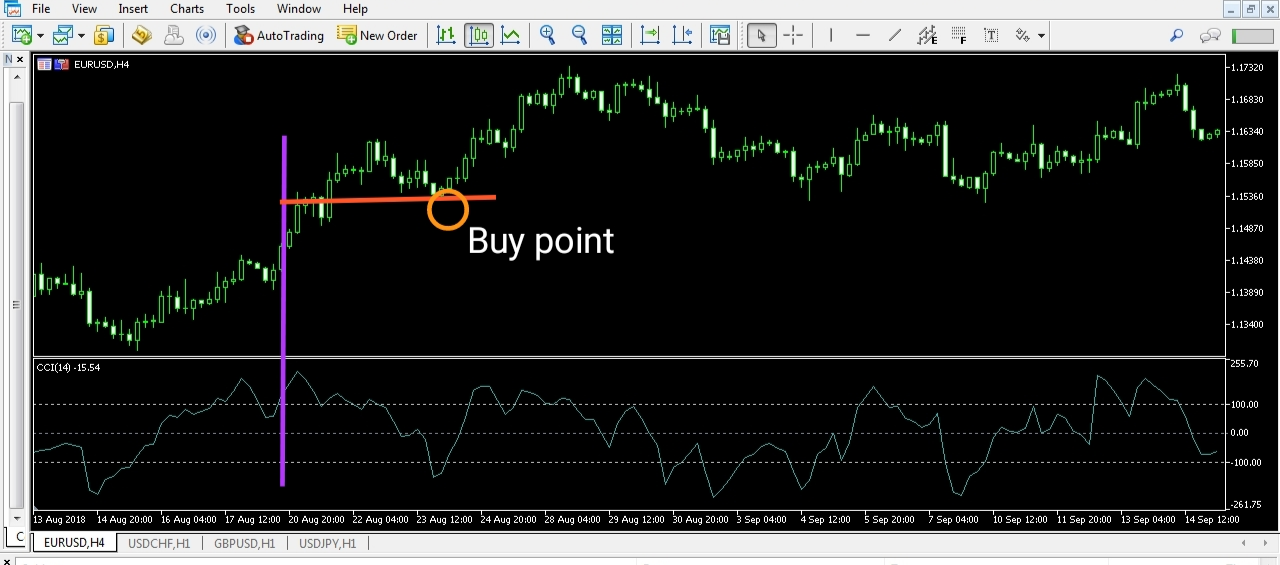
When the CCI line breaks through the +100 line, a buy order is not triggered. Instead, we wait for the price to trend upwards, and once the pullback or retracement starts to take place, a buy is initiated at the nearest support/resistance. And the stop loss can be kept right below the support level.
Example (Buy): Buy is taken when the price retraces to the recent support/resistance (orange line).
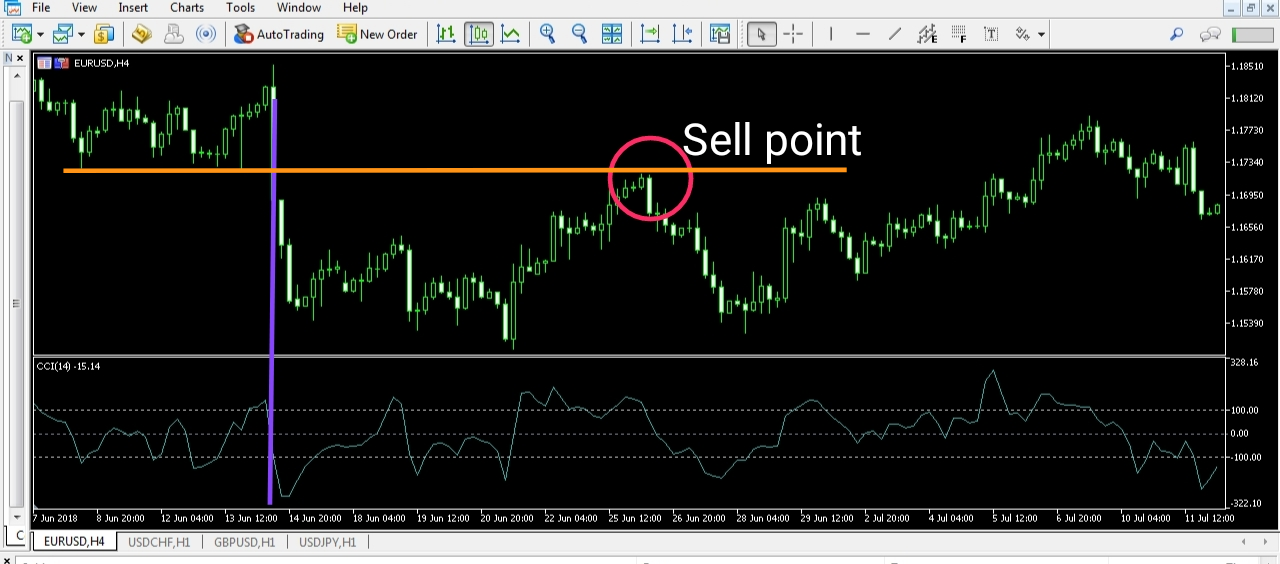
Example (Sell): Here, the currency is sold when the price pulls back to the orange support/resistance line.
Cons of Commodity Channel Index
The CCI indicator forecasts false signals as well. The price movement does not just solely happen due to the CCI. Hence, your complete technical analysis shouldn’t just be based on this indicator. Another flaw with this indicator is that we cannot determine the right logical stop loss, which is an important factor in trading.
Conclusion
- CCI is one of the most famous indicators among traders who use Technical Analysis.
- It is a leading indicator that helps in giving a high certainty for the future trend in the market.
- CCI stands out from the rest of the indicators as it is a multipurpose indicator.
- It can be determined by different methods like, by identifying overbought/oversold level, using divergence, drawing a trend line, etc.
- However, this indicator must be applied in conjunction with technical analysis.
- There are many other aspects that influence the price action which cannot be determined by CCI. Hence use this indicator wisely, and do not make your trading decisions entirely depending on the CCI alone.
