

The MACD Indicator
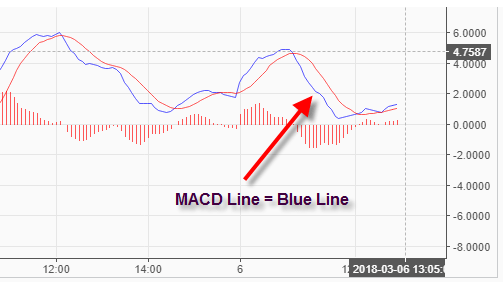
MACD AKA. Moving Average Convergence and Divergence the most popular technical analysis indicator used by the traders these days. It is generally used to trade trends. This lagging indicator consists of two lines, one being the MACD line, and another is the signal line. MACD is calculated by subtracting the 26-period EMA from the 12-period EMA, and the result of the calculation is nothing but the MACD line. The 9-period MACD line is the signal line which traders followed to buy and sell signals. It also helps the traders to understand the strength or weakness of the trend (either bullish or bearish) in a currency.
The MACD Formula
MACD Line:12-day EMA – 26-day EMA
Signal Line:9-day EMA of MACD Line
MACD Histogram:MACD Line – Signal Line
- MACD – It is easy to calculate the MACD value as all you need to do is to take the value of 12 Exponential moving average and subtract it from the 26 days exponential moving average (12-day EMA – 26-day EMA). The result you get is your MACD line.
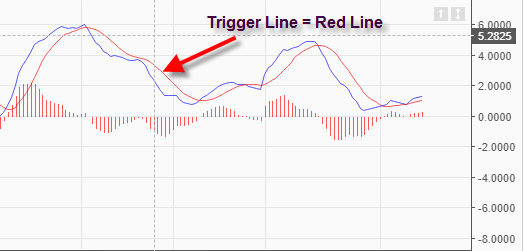
- Signal Line – To calculate the Signal line, you need to take the historical value of the MACD line and then divide it by 9 (9-day EMA of MACD Line). This will give you your Signal line. This signal line is used to smooth out the daily ups and downs of the MACD line.
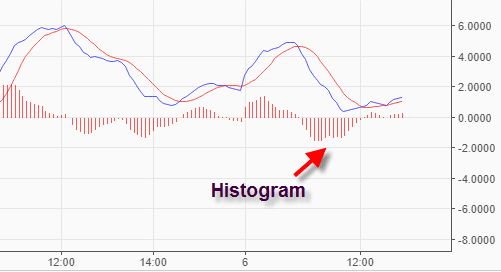
- Histogram – You can obtain histograms by subtracting the value of the MACD line against the signal line of the indicator. (Histogram = MACD line – Signal line)
Default settings of the MACD Indicator
The default setting of the MACD parameters is “12,26,9”.
The number ’12’ represents the previous 12 candles of the faster-moving average.
The number ’26’ represents the previous 26 candles of the slower moving average.
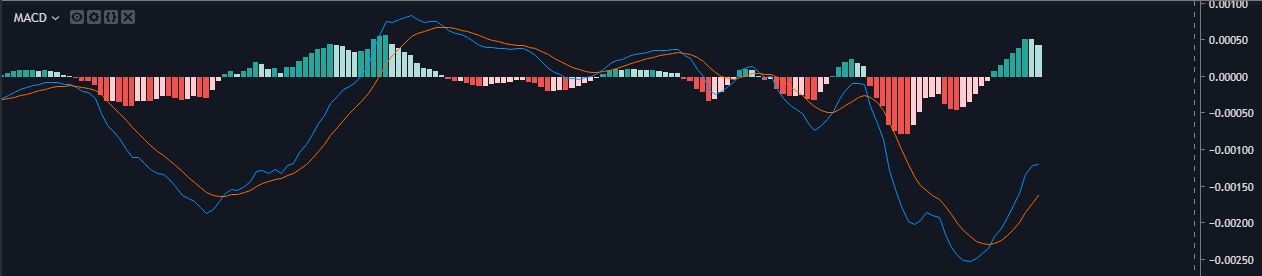
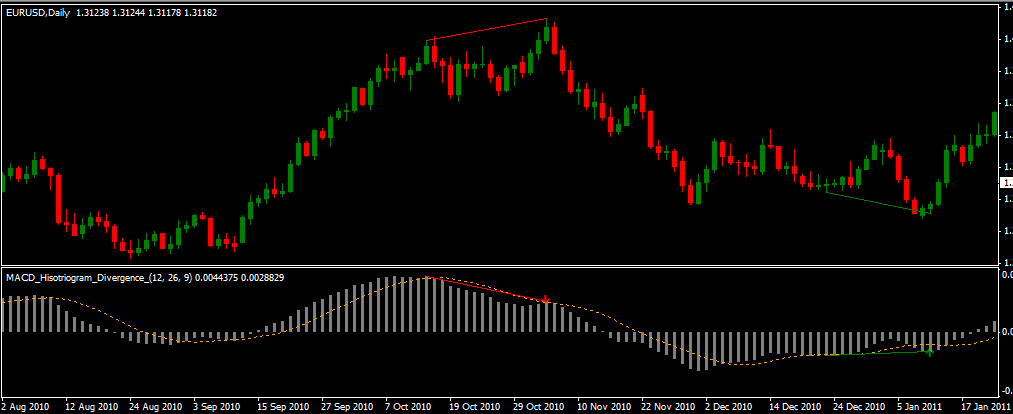
The red vertical lines on the indicator are histograms, and they are the most visual part of the MACD Indicator. As discussed, this histogram is simply the difference between the faster and slower moving average (MACD line & the Signal line). When these moving averages separate from each other, the histogram gets more prominent as the difference is more. This is called divergence, and it means the faster moving average is moving away from the slower moving average. When they get closer to each other, the histogram gets smaller as the difference between the two lines is less. This is known as convergence as the faster moving average is getting closer to the slower moving average. And this is how this indicator got its name.
How to install the MACD Indicator (Step by step process)
The MACD is a standard Meta trader indicator. Most of the brokers provide this indicator in their terminal. Even if you are using MT4 for your trading activities, this indicator is available by default.
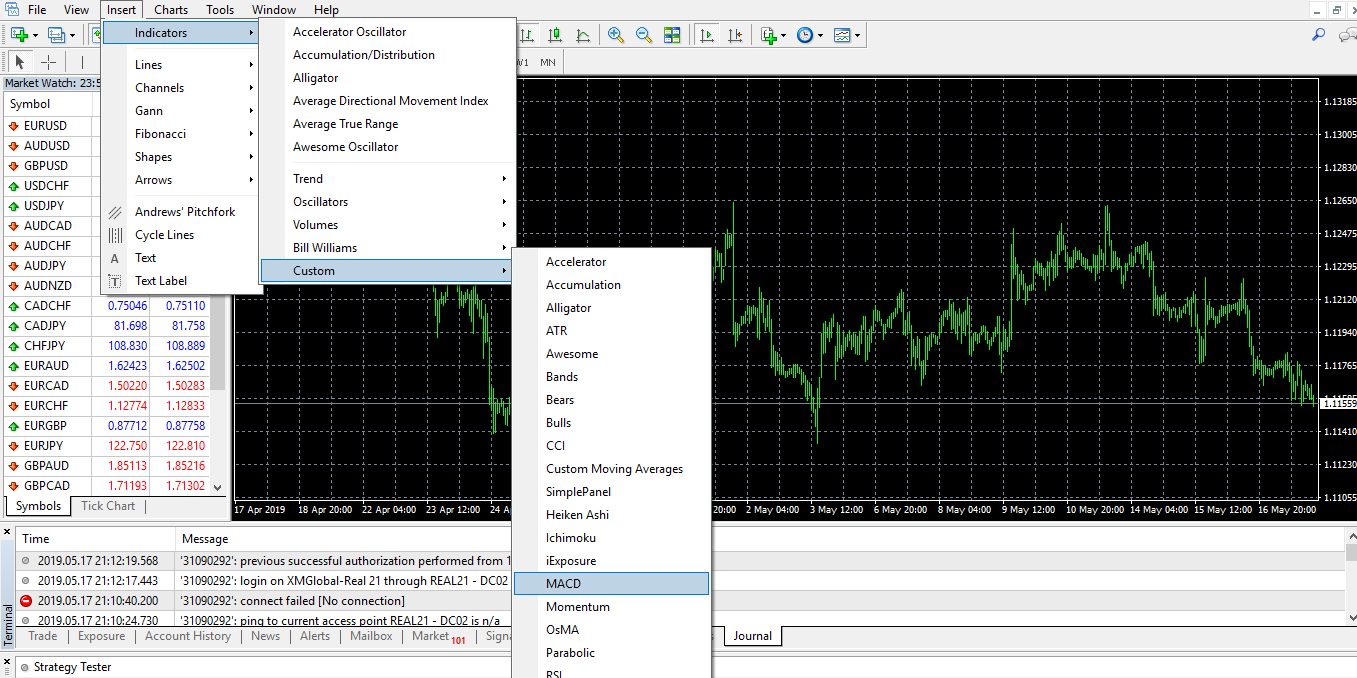
Open your MT4 terminal (refer to the image below). Click on the ‘insert’ window, and select the ‘custom’ option. A list of indicators and other trading tools will pop up. Click on the ‘MACD’ Indicator.
Once you click on the MACD Indicator, a small box will prompt, which shows you some of the parameters. Here you can easily change the period according to your trading style. We recommend you to use the default parameters.
In the image below, you can see the MACD indicator applied to EUR/USD chart, on a daily timeframe.
Pros and Cons of “MACD Indicator”
None of the indicators is perfect for making money in the market. However, MACD is an excellent indicator as it measures momentum. But even this indicator has its drawbacks. So it is better to use this with the other significant indicators to predict & confirm the direction of the market.
One of the significant problems of MACD is that it predicts way too many reversals. In reality, some of them are false signals. As we know, MACD is a trend following indicator. It means when the market is trending, this indicator generates more reliable and trusted signals. But when the market is moving sideways, there is a possibility of the occurrence of fake positive divergence. The reason behind this fake divergence is when the market slows down the MACD pulls away from its prior extremes area and is gravitating towards the zero lines.
By using MACD along with price action, candlestick patterns, support/resistance, or any other indicators, traders can dramatically improve their win rate. After all, it depends on the experience and skill set of the traders to choose which signal is accurate and which is not.
Strategies that traders can build using the ‘MACD Indicator.’
Strategy 1 - MACD + Relative Vigor Index
Combining MACD & RVI makes a powerful strategy for traders in forecasting the price action. RVI will give a clear idea on overbought and oversold conditions in the market, and at the same time, MACD will confirm the momentum or strength of the trend.
When both of these indicators give sharp reversal from the top or bottom, we can consider that as a signal to buy or sell. If both of the indicators cross from the top, we can consider that as a sell, and when both of them rise from the bottom, we can consider that as a buy signal. Timeframe doesn’t matter for this strategy, but we suggest you consider a 60 and 15-minute chart if you are an intraday trader.
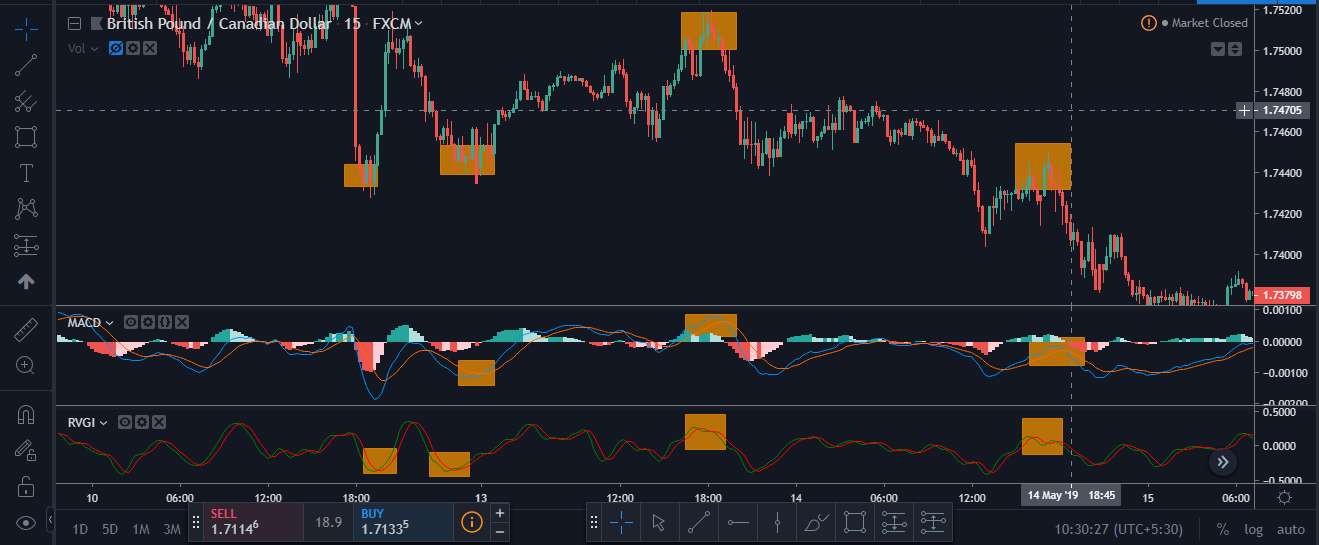
In the image below, you can see that RVI and MACD crossovers are giving a buy and sell in the GBP/CAD pair. It is a good strategy that can help you in giving a strong buy/sell signal.
Strategy 2 - MACD + Money Flow Index
The money flow index focuses on both price and volume. MFI is a reliable indicator, but it generates fewer signals as it needs movement in price action and upsurge in volume as well. The strategy is to use MACD crossovers at top and bottom along with MFI. When the MFI reaches the overbought and oversold conditions, it gives us a sharp reversal. We can consider this as a strong sell or buy signal. As mentioned, this strategy generates fewer signals, but when it does, they are accurate and work 8 out of 10 times.
Below is the GBP/CAD chart in 15 min time frame. As you can see, the prices are at a significant resistance area, and MACD crosses the signal line from the top. At the same time, MFI is showing overbought signals. As a result, we got a sharp reversal to the downside.
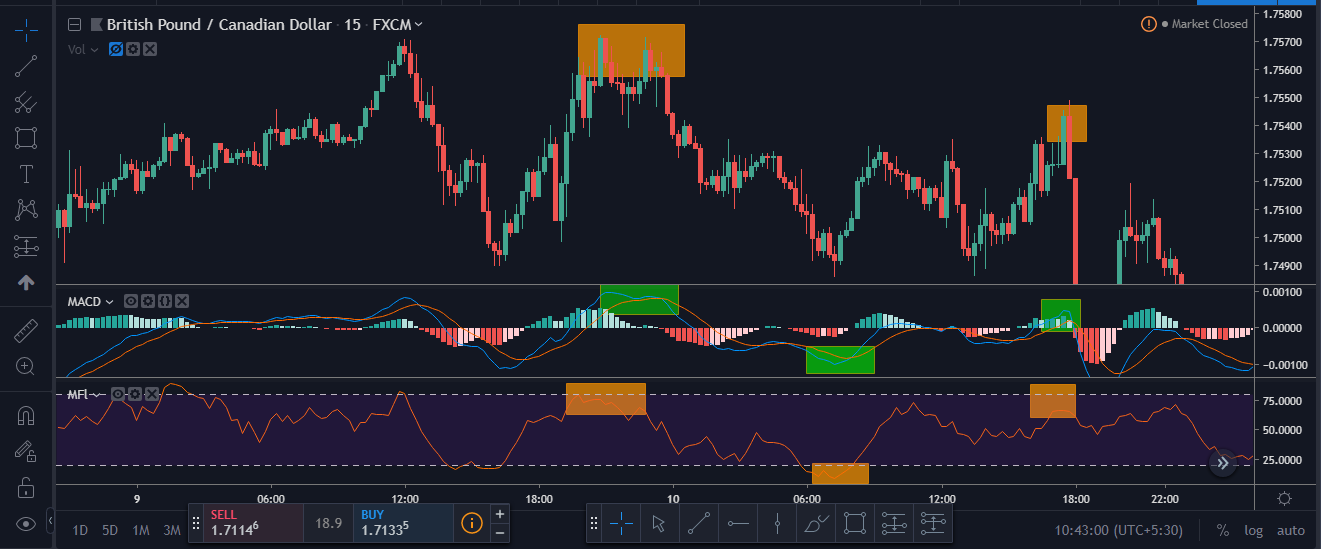
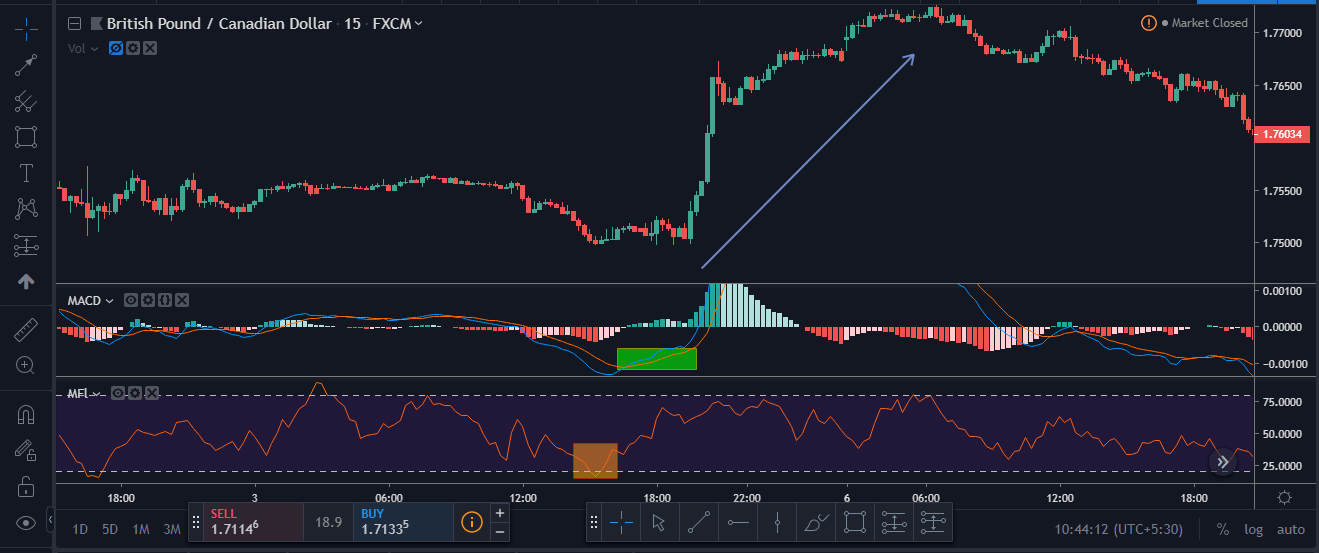
In the below image, you can see that the market was in a range. As the MACD reaches the bottom and MFI shows oversold signs with a quick sharp reversal, we can conclude it is a strong buy signal.
Conclusion
The MACD is a trend following, momentum indicator.
We won’t suggest you to blindly trade only MACD crossovers. But if you can pair it with some other popular indicators they can give strong buy and sell signals.
When the MACD histogram is flat, it is a possible signal for a major breakout in the market.
According to the trading experts, MACD works best with the following indicators: Relative Vigor Index (RVI), Money Flow Index (MFI), Triple Exponential Moving Average (TEMA) and Triple Exponential (TRIX).
Please let us know if you have any questions regarding the same in the comments below. It would be interesting, also, if you could mention any other indicator you paired MACD sucessfully.
