
In the financial markets, the price often moves by obeying up trending/down trending trend lines. There are traders who only trade on trend line and make a profit out of it. Without any doubt, trend line trading is profitable. However, trend line breakout trading is even more profitable. Today we are going to have a demonstration on how to trade on a trend line breakout.
Analyzing the Market
At first, we have to be able to identify the trend and find out whether there is a trend line can be drawn. It might sound a bit complicated at the beginning, but with a lot of practice, it gets an easy task. Let us have a look at the chart below.
We see a double bottom was formed here. The price kept moving towards the upside by making a breakout at the neckline of the double bottom. Is there any pattern that the price is maintaining here? Yes, there is. The price is up trending by obeying an up trending trend line. Have a look at the chart below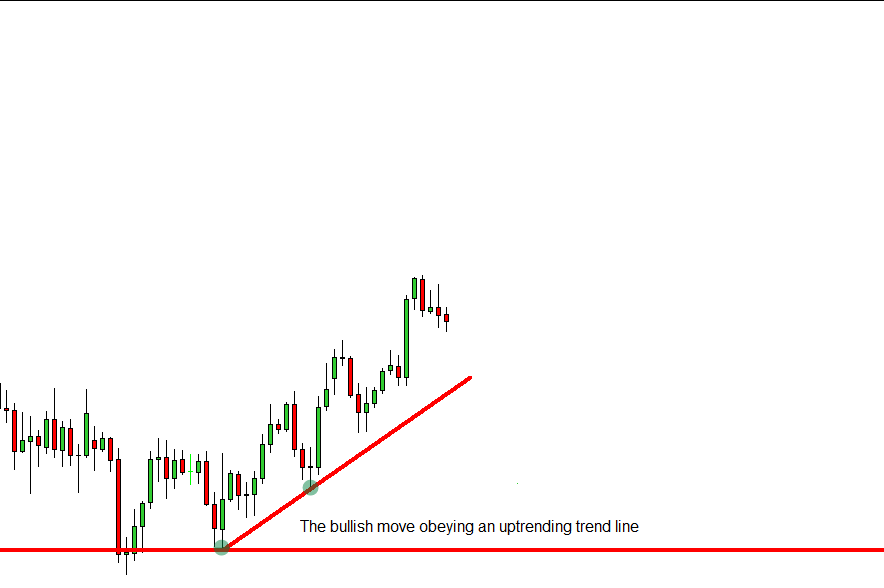
We are able to draw an up trending trend line. The price went towards the upside by making a morning star right on the support level of the drawn trend line at the second point. Now we have to wait for the price to come at the support level again to give us another bullish reversal signal to go long. Let us wait and see what happened next.
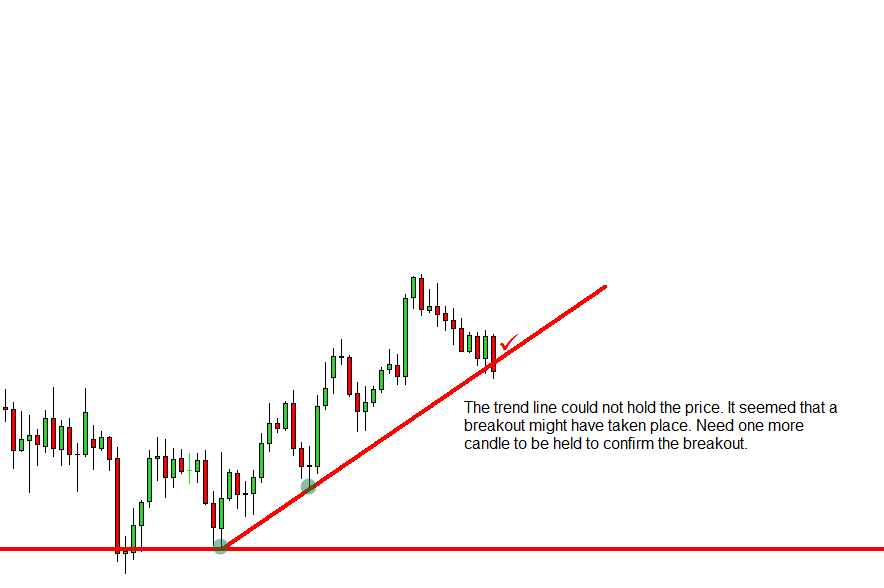
The price did make a bullish candle right at the support level of the trend line. However, there was no upside breakout. The price rather came down by producing a bearish engulfing candle (the ticked candle). In fact, it made a bearish breakout on the drawn trend line. The breakout is not very explicit.
Nevertheless, it is a breakout. To be confirmed about the breakout, we need one more bearish candle closing below the trend line. Let us have a look at how the next candle came out.
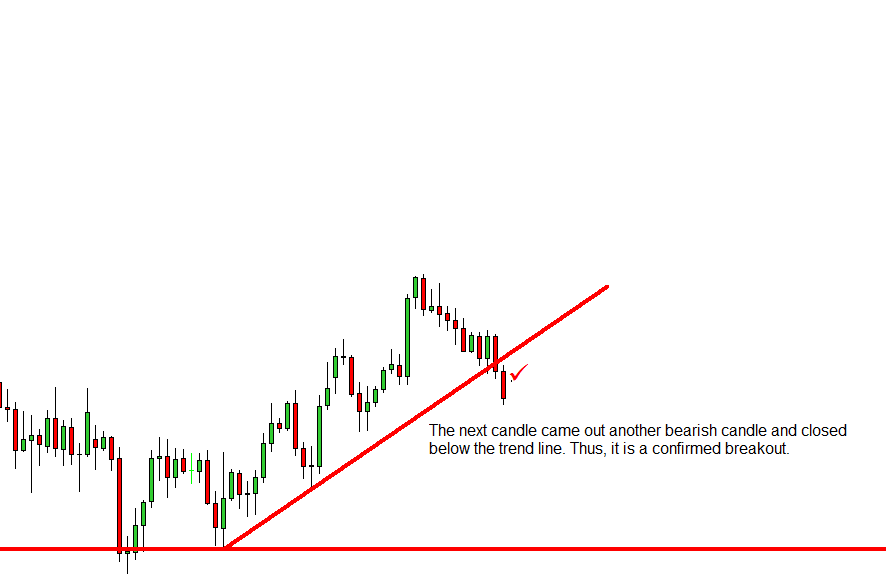
The ticked candle was the very next candle of the breakout candle. It closed below the trend line as well as the breakout candle. Thus, there is no more confusion about the breakout here. In fact, this is the signal for the sellers to go short on the pair. It is interesting that two more candles before traders were looking for buying opportunities. Once the ticked candle closed below the trend line, traders would be looking for selling opportunities here.
Setting Take Profit
We have one more lesson here. With naked eyes, the take profit should be set where the support line was drawn. Did the price actually come up to that level? Have a look at this.
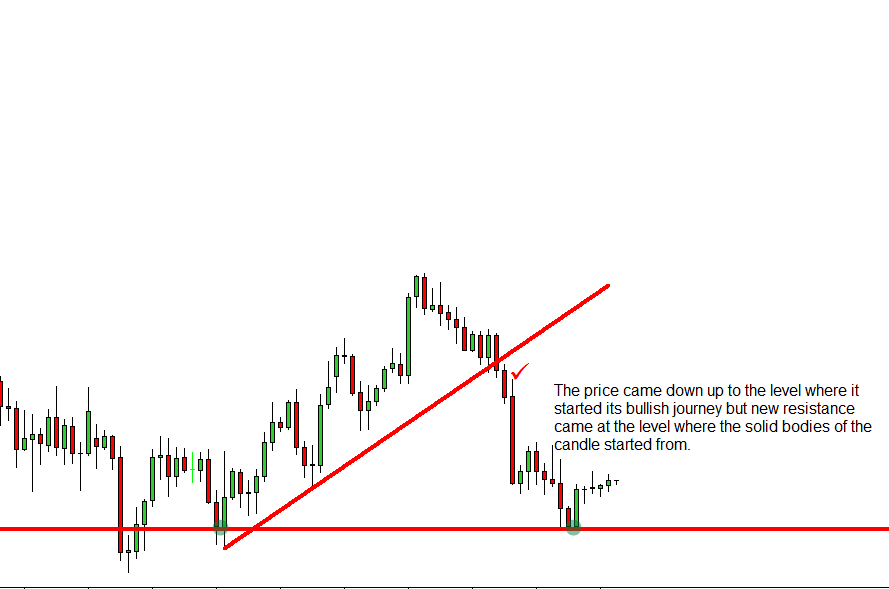
The price did not come up to the level where the trend started. In fact, it came to the support level where a new support line was drawn. The question may be raised here why it did not come up to the level. See the bodies of those two candles. The price started having a reversal right from that level, which was drawn with the bodies of those two candles. It means at the time of setting our take profit level; we have to be bit considerate and sensible. Two consecutive candles’ bodies where the last trend started lied on a level must have some significance among the traders’ trading plan. This must not be overlooked.
Things to Remember
There are some points to remember to trade on trend line and trend line breakout trading. These are as follows:
- It needs at least two price touching points to draw a trend line.
- The more price touching points we get on a trend line, the better it is.
- The breakout candle has to be a commanding candle which represents an explicit breakout.
- If the breakout is not evident, then wait for the next candle.
- Risk and reward ratio must be evaluated.