

Maximum Adverse Excursion
We are prepared to trade. We know our signals are profitable long term. The system delivers a long or short signal and we pull the trigger. But, how to maximise our chances that the current trade will be profitable while cutting losses as short as possible? is there a methodology that allows us to optimise this parameter?
The usual method to cut losses is to look at the chart look at the latest significant bottom or top (on short positions) and put our stop a few points/pips below or above it. But is this the best approach? Is there a better alternative?
John Sweeney in his book Campaign Trading and later in “Maximum Adverse Execution” defined the foundations for a statistical approach to stops, in such a way as to minimise risk with minimal harming to profits. He does that by attempting to maximise the ratio Profit/MaxDrawdown. The additional bonus is that stops commonly end at places far away from the common levels that most traders use.
Sweeney’s main premise is that if the entry signals of your system are sound, there will be a difference in how winners and losers behave. According to him, winners shouldn’t move too far into the negative territory.
If we examine figure 1 we see the adverse excursion of the trades on the EURUSD 1H chart for a strategy with no stops. Green dots represent the trades that finally made profits while red dots ended up being losing trades. We could notice there is a spot where a stop could be placed that may prevent further losses without almost no harm to winning trades.
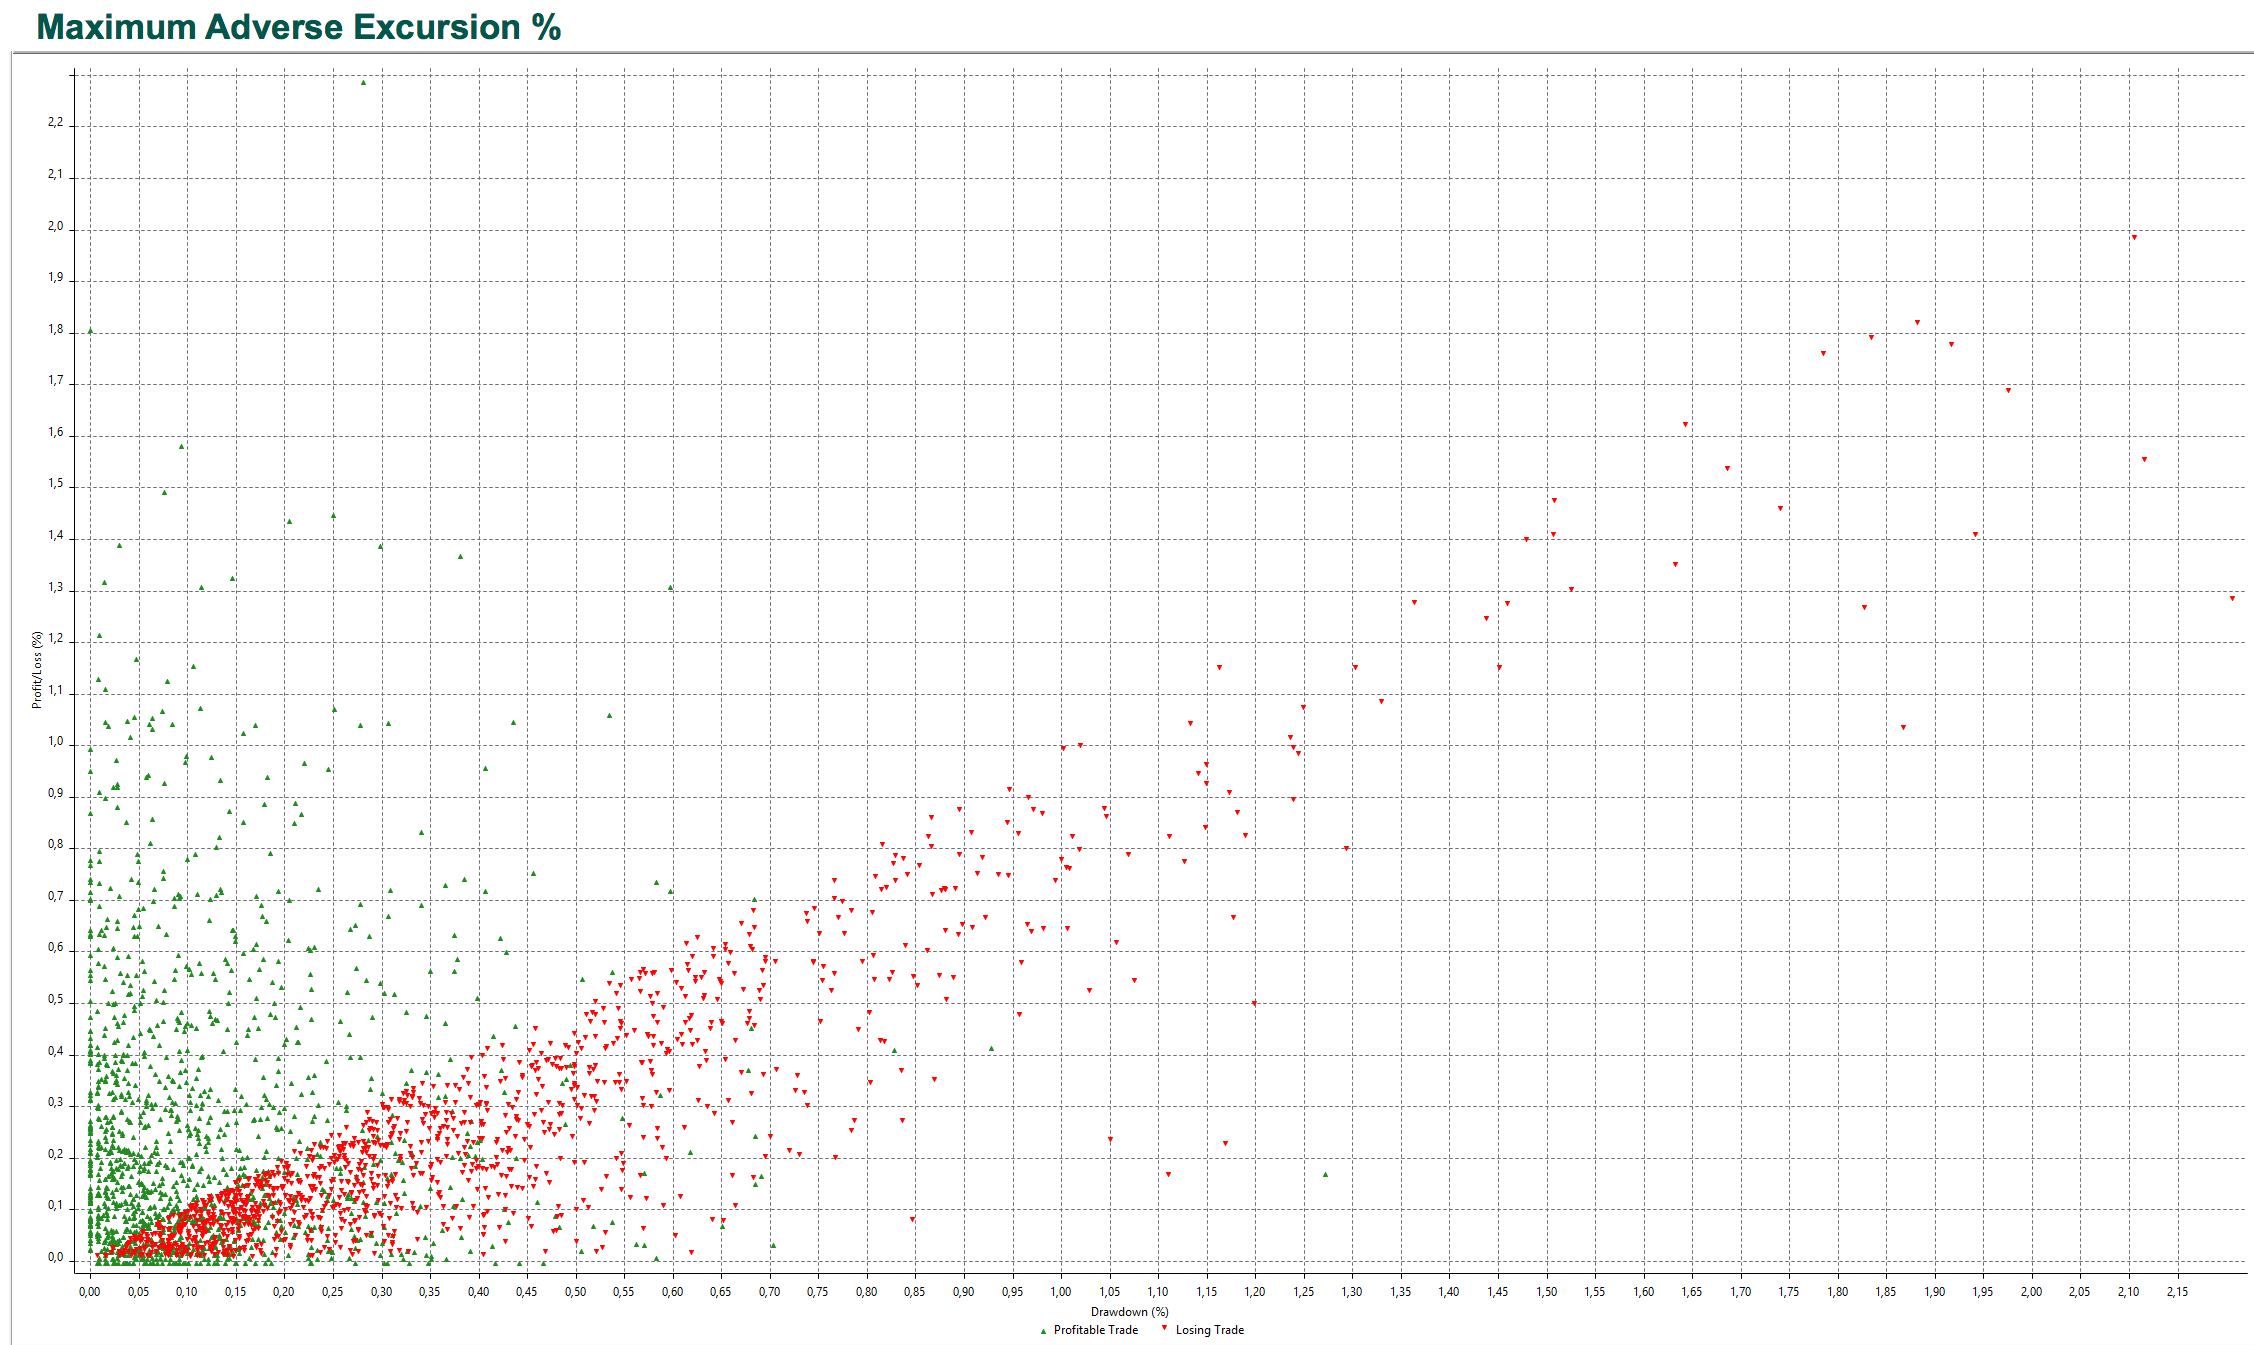
Fig 1 - Adverse Excursions of trades on 15 years of the EURUSD 1H Chart.
And this is the table showing the main parameters of the raw system
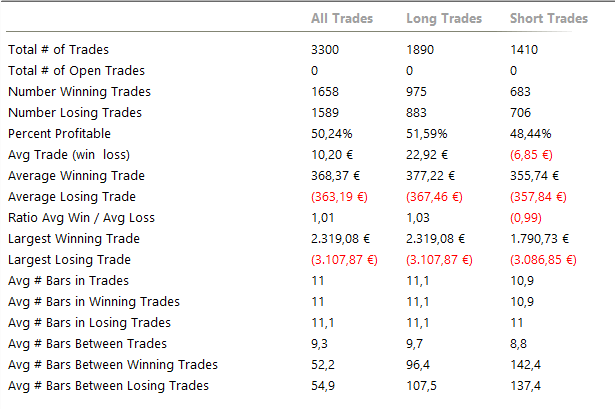
Table 1 - EURUSD 1H Strategy Total Trade Analysis
The system shows 50.24% winners, and 1.01 Reward to Risk Ratio. The average loser is €363.19 while the largest one is 3,107.87 €. Not a good system indeed.
If we observe the above chart we see that the ideal spot to close losing trades is near 0.6%.
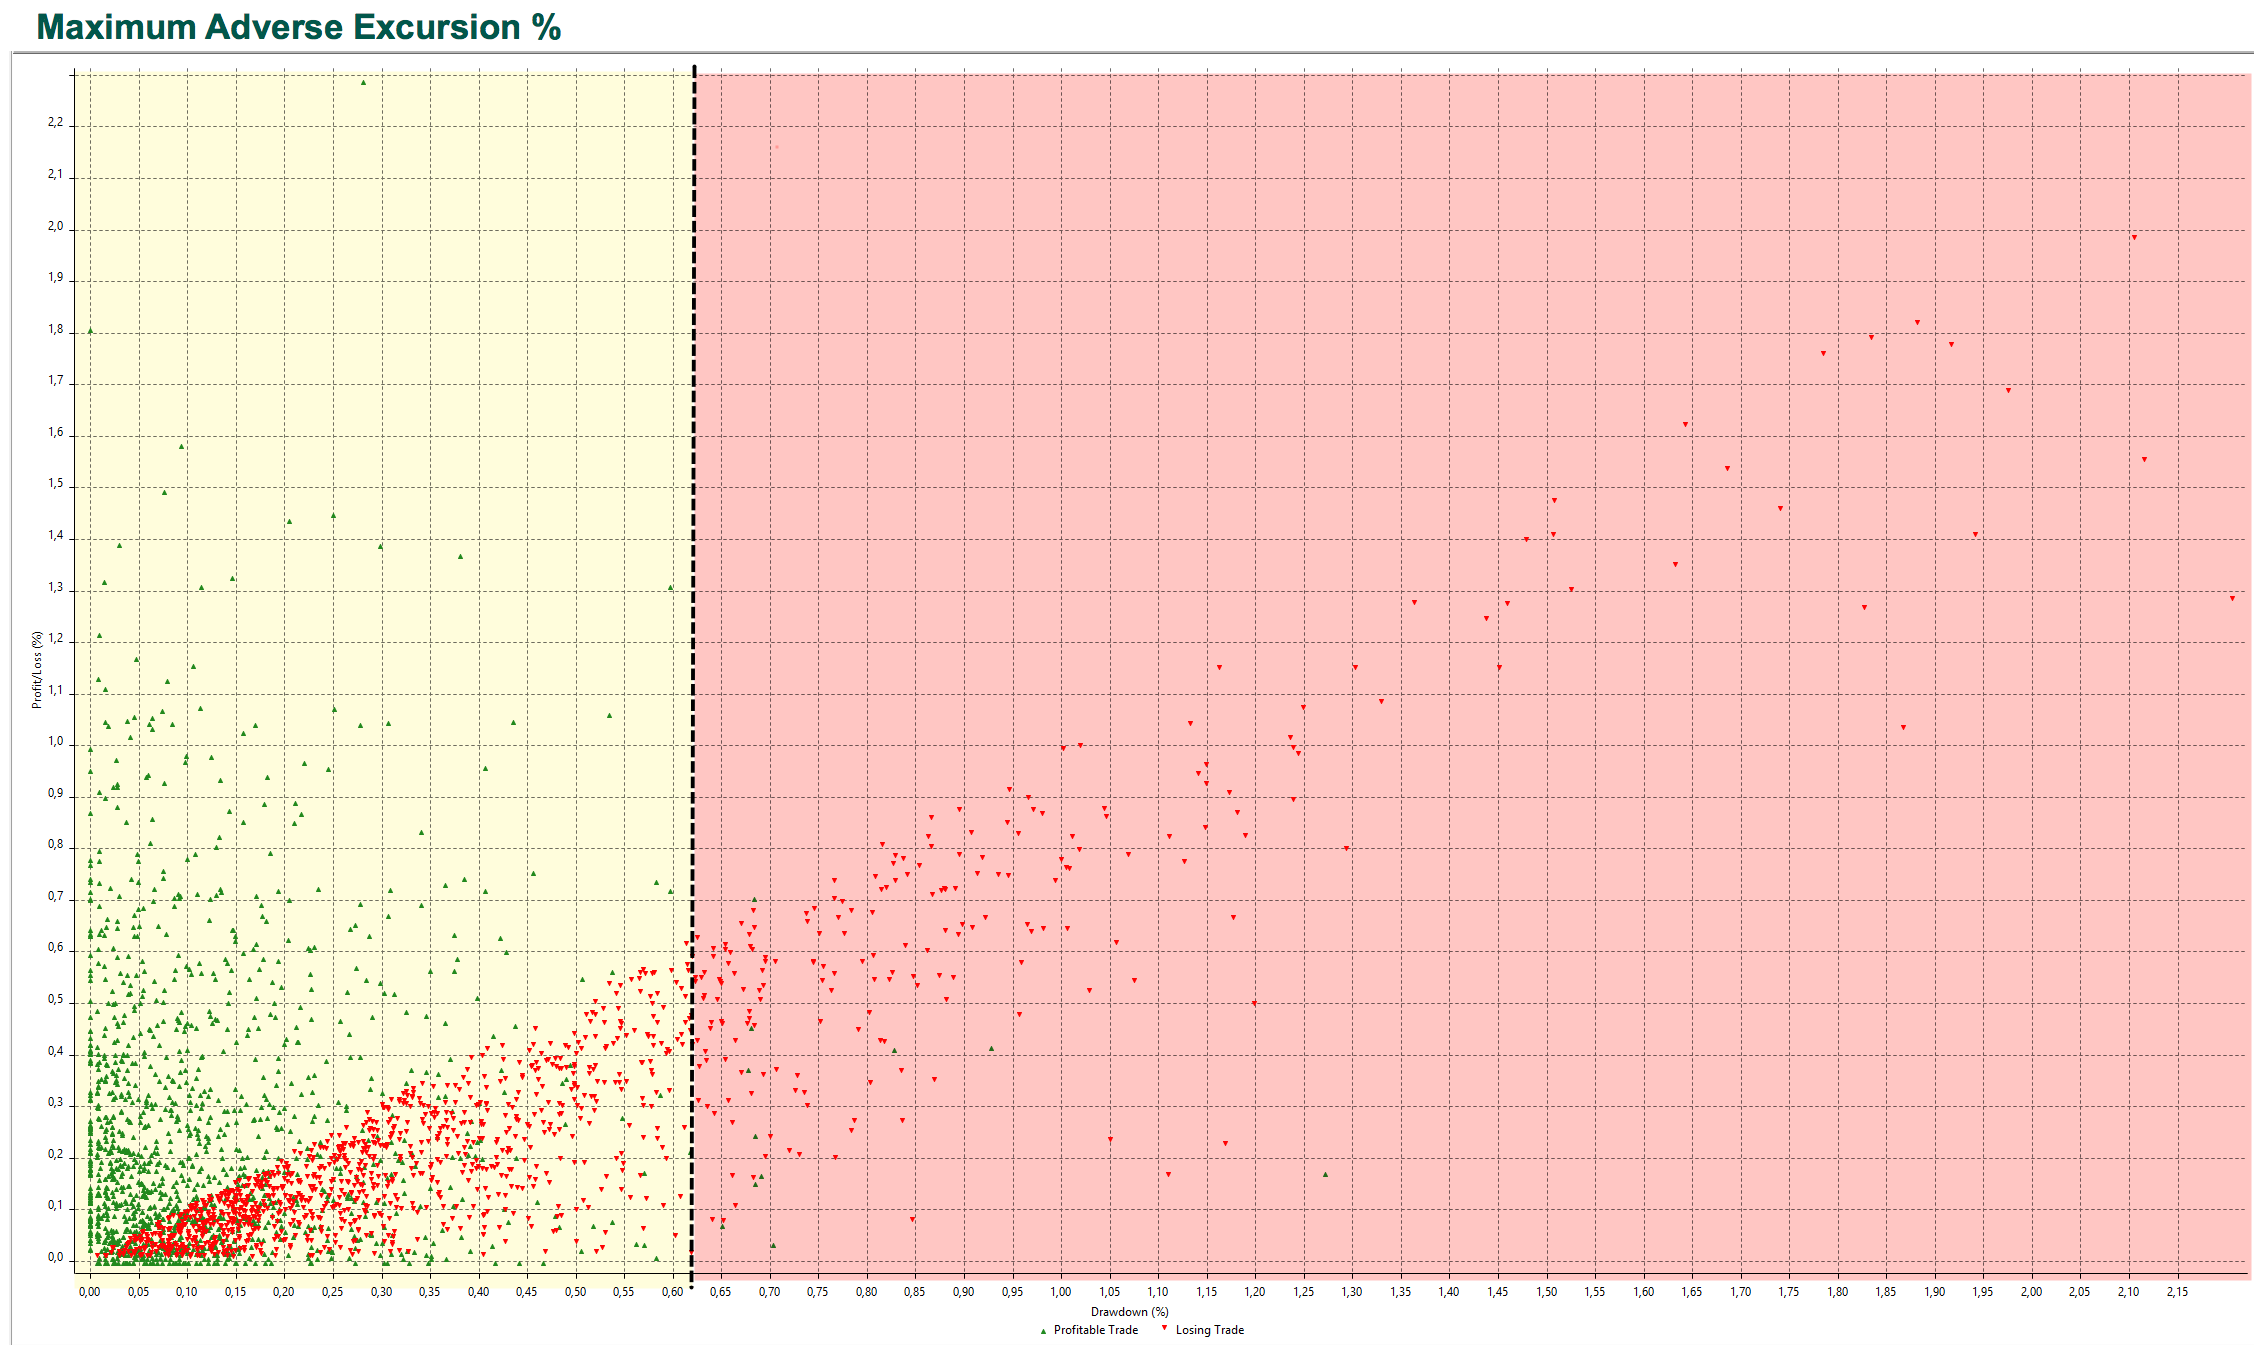 Fig 2 - The Ideal spot for Stop-Loss Placement
When we set the stop loss to that place, together with a trailing stop trailing the same 0.6% amount we see the following distribution of Adverse Excursions:
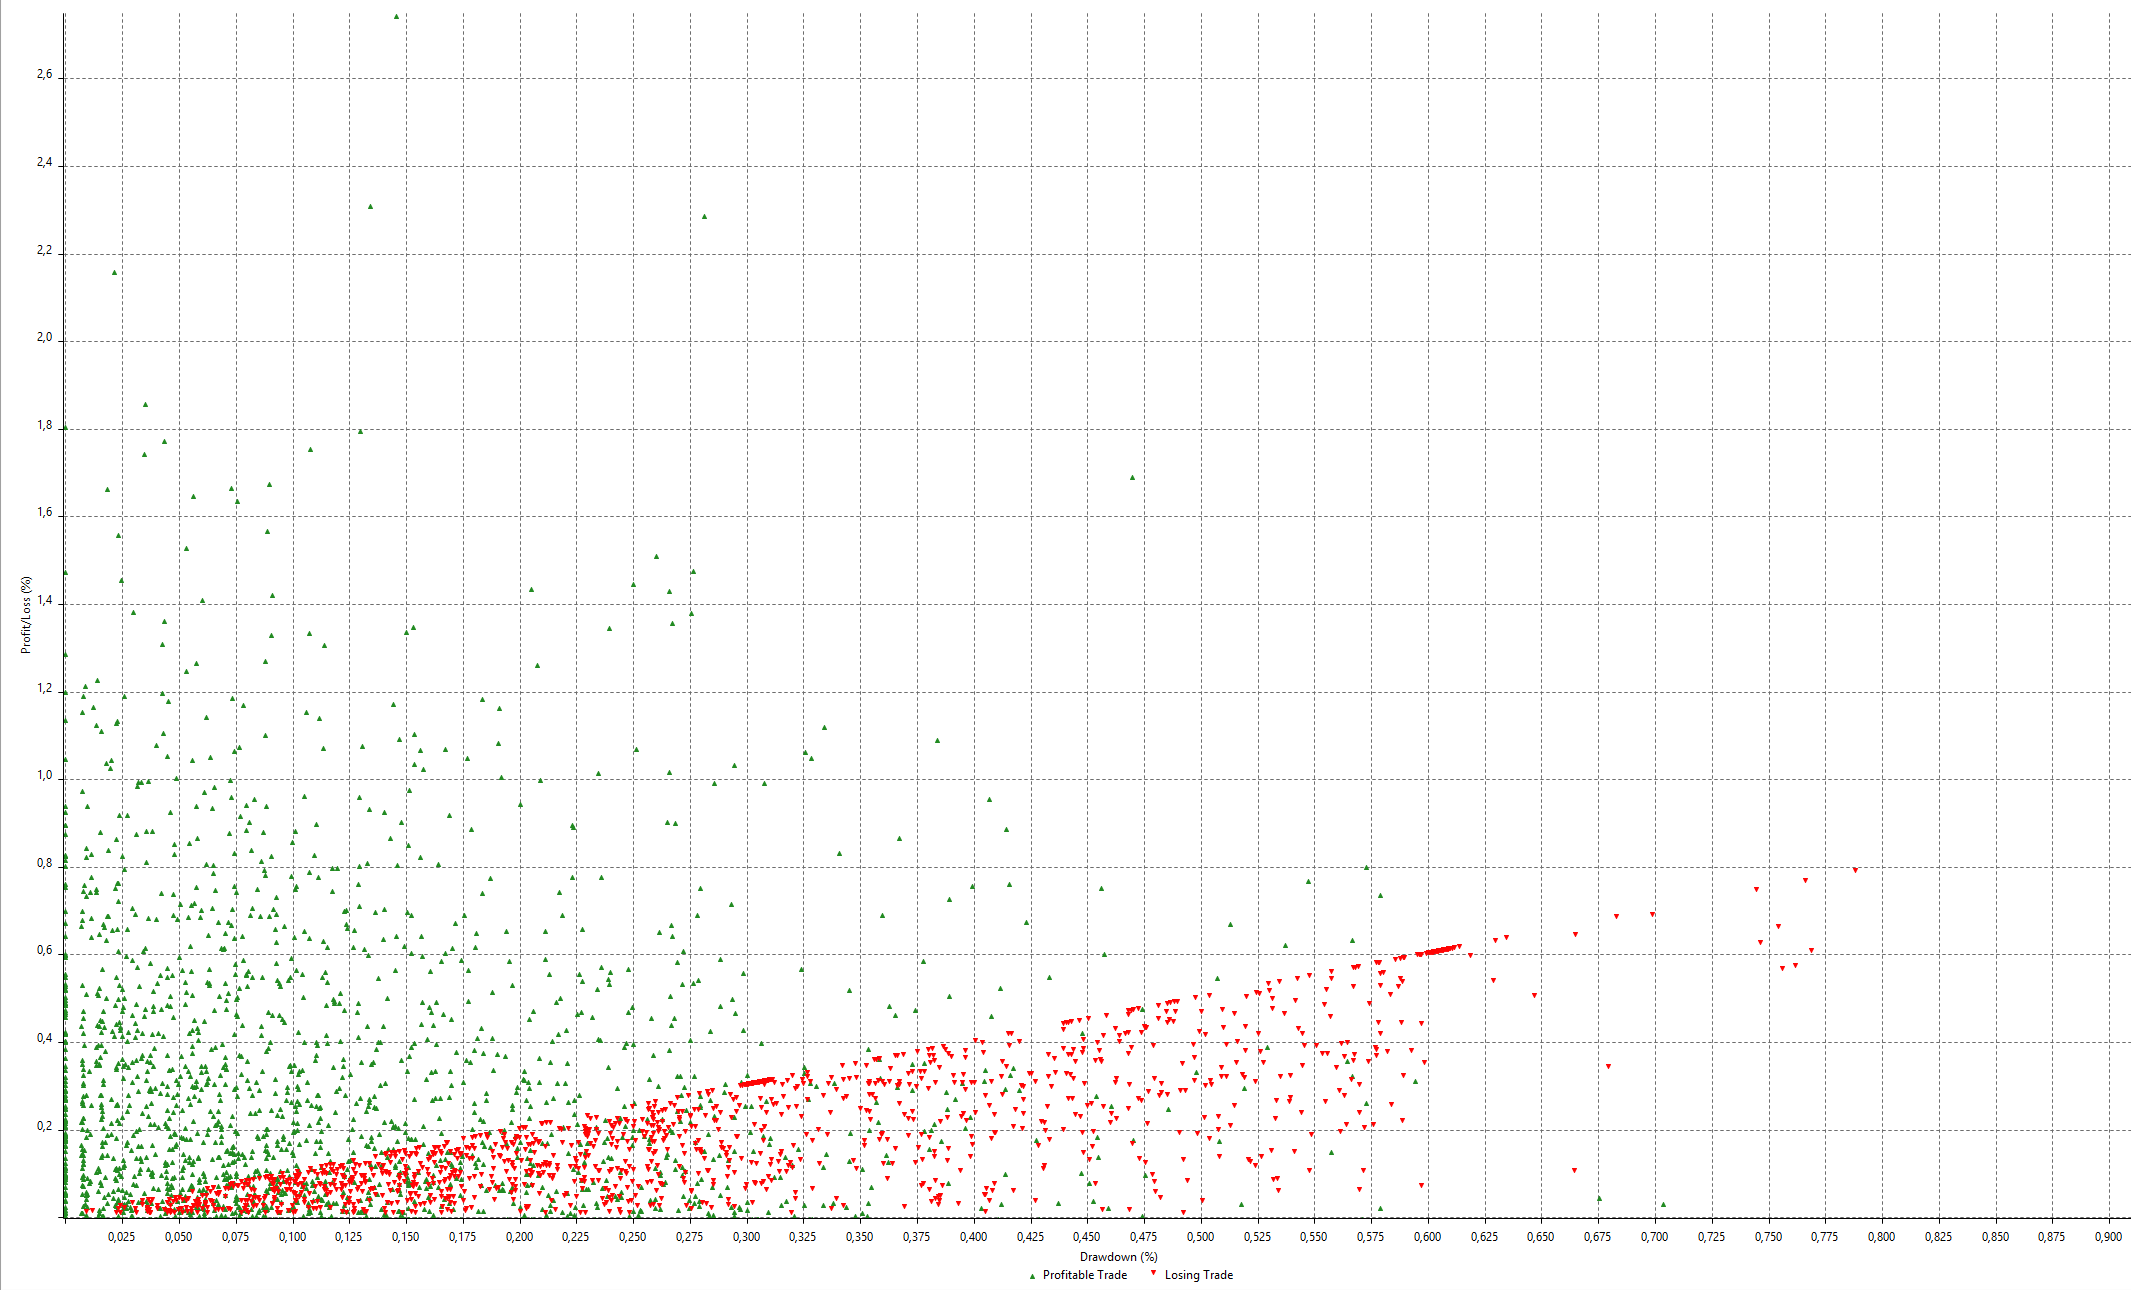
Fig 3 - Stops At Optimised using the MAE Concept
And the following table shows the change in the main parameters of the system:
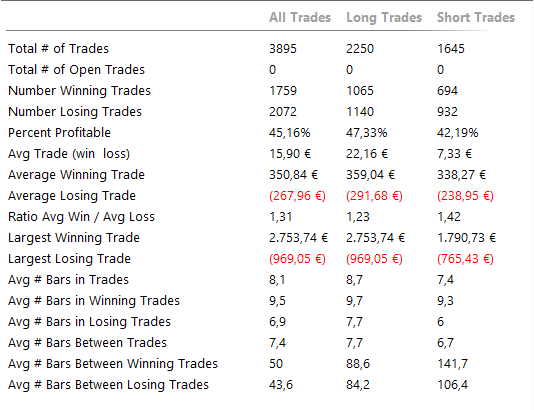
Table 2 - Total Trade Analysis on the EURUSD 1H System after MAE Stops
We can observe now that the average losing trade diminished by 26% to 267% and the largest losing trade is now 1/3 of the original max figure. The per cent winners dropped five per cent points, the Reward to Risk Ratio increased to 1.31, and although not seen here, the overall profitability of the system doubled.
Maximum Favourable Excursion
The same way we have optimised the stops can be applied to profits. John Sweeney devised a similar concept to Gains: The Maximum Favourable Excursions.
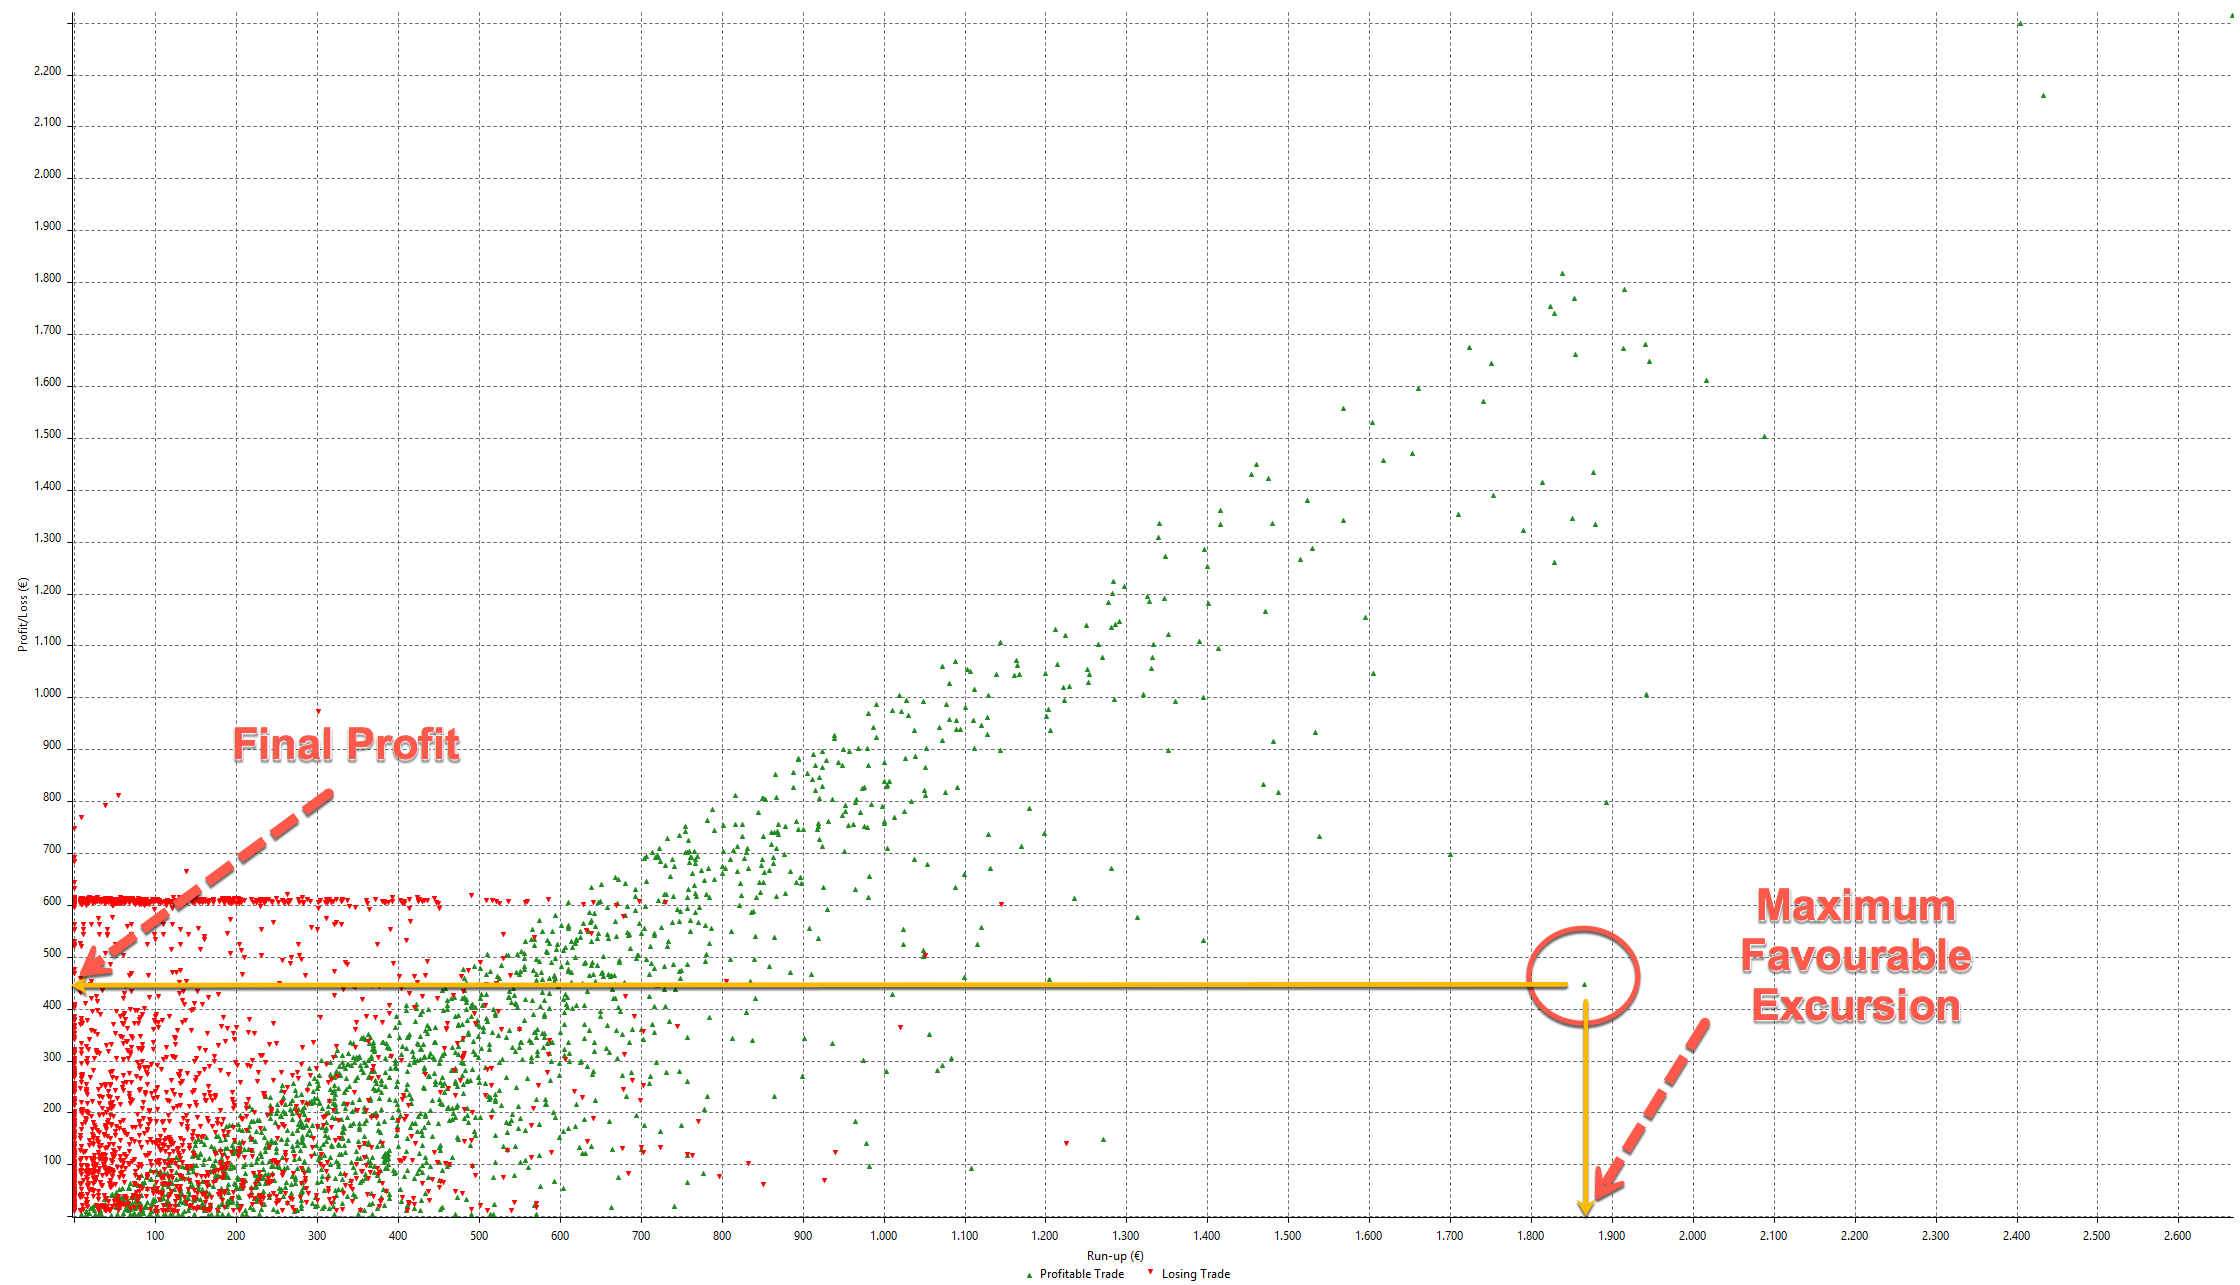
Fig 4 - The Maximum Favourable Excursion Concept
We observe that often the final profits are much less than the maximum attainable profit. The idea of the MFE is the same: The search for a target level that improves profitability without hurt too much long runners.
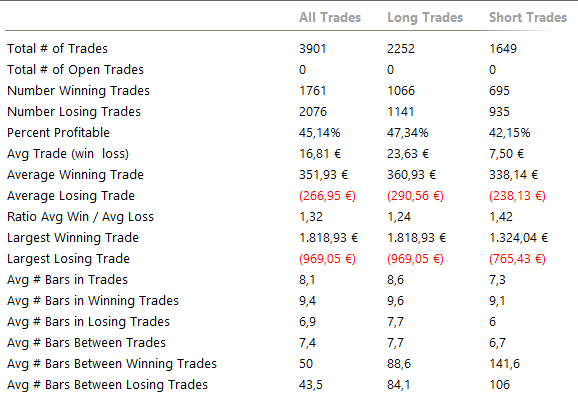
The Maximum Favourable Concept, looks good, but in practice, I haven’t found any advantage of using it, although it doesn’t hurt the system. Here, for instance, we see that there is almost no improvement in the Total Trade Analysis parameters of the system.
 To Conclude
- The Maximum Adverse Execution MAE is a novel concept for the placement of the stop losses.
- MAE needs to be optimised by hand or using a Trading platform that allows backtesting.
- If optimised by hand, the trader needs to store not only the information on profits and losses but the MAE itself, by registering also the maximal excursion on all trades, including those that were stopped and reversed after the fact.
- The Concept of MFE Is less critical for the profitability of the system and shows almost no improvement if the trader has already applied a trailing stop, as was the case.
Image Credits: All images produced and by courtesy of Multicharts 12 (TM) Platform.
