

What and How to Interpret the Candlestick Chart
Candlestick Chart plays an important role in the Financial market. It is the most commonly used chart since it offers more benefits for the traders. The reason behind this is a Candlestick Chart reflects the true colour of the market. There is a saying in the financial trading “Trend is your friend”. Using Candlestick Chart in trading has become a trend among the traders. Thus, it is important for a trader to understand how the Candlestick Chart may help him be a better trader.
Understanding Candlestick and the Chart
Candlestick chart is made of various candlesticks such as Hammer, Inverted Hammer, Pinbar, Engulfing Bar, Inside Bar, Doji, and Marubozu. Collectively they produce different chart patterns such as Evening Star, Morning Star, Abandon Baby, Three White Shoulders, Three Black Crows, etc. The candlestick chart pattern and all these names might sound a tough task to remember at the beginning. Matter of fact is we do not even have to memorise candlesticks’ or chart patterns’ names. We only have to understand market psychology which is represented by a single candlestick or a group of candlesticks. By understanding the psychology of a candlestick or a group of candlesticks, we will be able to use candlestick chart accordingly in our trading and make a profit out of it.
Know Your Candlestick
Pinbar
is a short form of ‘Pinocchio Bar’. It is a strong reversal signal, which traders love to see on a significant level of support/resistance.
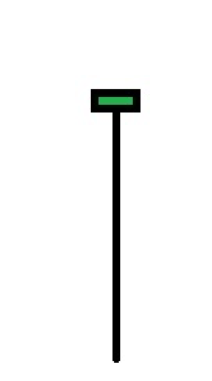
This is a bullish Pin Bar. Does the candle make any statement? It does. It says that sellers have lost their interest to sell here any more. They have gone out with their profit. That is what produces the long shadow. The long shadow and a very thin body (in this case it is green, it can be red coloured as well) is an indication for the buyers to get ready to look for buying opportunities.
Hammer
A hammer looks very similar to a Pinbar. However, it has a bigger body and the shadow is comparatively smaller than a Pinbar. Have a look at this.
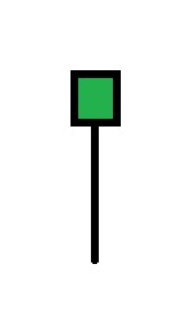
The shadow is the indication that the sellers have achieved their target and gone out. The body is green and thick enough to be noticed. This is an indication that the buyers have started to show their interest a little to go long. If the body was red, how would we interpret that then? With a long shadow, a little red body also attracts the buyers to look for buying opportunities too. The psychology behind a Hammer Candle’s long shadow or rejection from a key level of support represents that the sellers have lost their interest. Hammer is a strong signal, but it is not as strong as a Pinbar is.
Doji
A Doji Candle represents the confusion among the traders. Neither the buyers nor the sellers have control over the market and that is when a Doji Candle is produced. This is how it looks like.
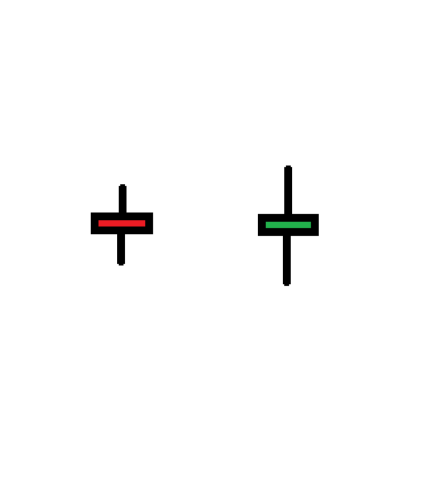
The first one has a thin red body (it can be green) with two small shadows. The second one has a thin green body (it can be red) with two long shadows. The psychology behind these two candles is the same. Buyers and sellers both are hesitant. Traders are going to wait for the next candle to find out the direction that they may want to go with. Things are to be noticed here are the body has to be thin, and both shadows have to have the same length, or there may not be any shadow at all. A Doji Candle itself is not a reversal candle. The next candle determines the direction.
Inside Bar
A candle has to be compared with the last candle, and it has to be smaller than the last one to be called an Inside Bar. Let us have a look at this.
The last candle is called bullish Inside Bar since it closes within the previous bearish candle. What statement do we get here? This is how it should be read. First of all, the market was bearish. It produced a huge bearish candle and closed with a tiny shadow. Sellers had the upper hand. However, once the candle closes somewhere, that level is considered as a support level. The next candle has come out as a bullish candle. This indicates to some extent; buyers are interested in the market to enter. This often reverses an existent bearish trend. Please keep in mind, as far as candlestick is concerned, among all other reversal signals, this is the weakest bullish reversal signal.
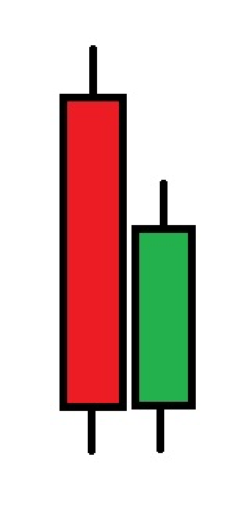
Mobuzu Candle
A Mobuzu Candle is one of the strongest reversal signals that the market produces. Let us have a look at this.
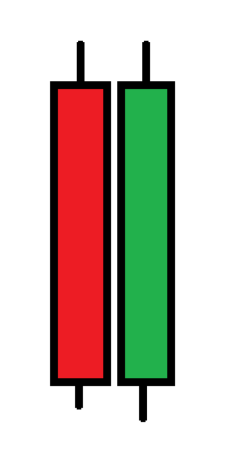
Two same length candles are standing together. This is how the statement should be read. The market was bearish. However, once the bearish candle closed on a level that has produced a bullish candle which has exactly the same length. Since the last candle has a thick green body, it indicates that the buyers have taken control over the sellers. Thus, more buyers are going to be added, and this is going to push the price further towards the North. It seems that Mobuzu Candle may not be a thing that occurs now and then since they have to have the same length. However, in reality, the market produces Mobuzu Candle more often than you may think.
Engulfing Candle
An Engulfing Candle is the strongest reversal signal among all other reversal candles. Let us have a look at this.
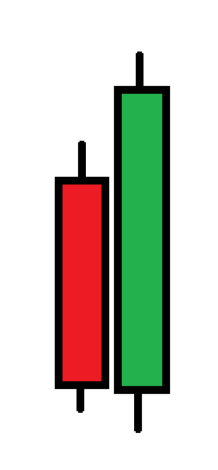
The very last candle has come out as a strong bullish candle which has engulfed the previous bearish candle. The statement it gives is crystal clear here. Buyers have taken full control. It attracts more buyers and demotivates the sellers. This is the reversal candle that candlestick traders love most for taking an entry.
Bullish to Bearish
All these examples are bullish reversal candles. For a bearish market, things will just be the opposite. A Pinbar will have a long shadow getting a rejection from the upside. A Hammer which is called Inverted Hammer in a bearish market will be upside down. The rest of the candles interchange their colours and instead of being produced on a support level, they are produced on a resistance level. In coming articles, I am going to give some examples from the market charts to make things simpler.
