
Renko Charts seems to start becoming the hot topic of many trading communities and internet groups.
What is a Renko Chart?
A Renko chart is another type of price graph that came from Japan. According to Steve Nison, the Renko Chart, as it looks made of blocks, it is referred to as bricks. And the term Renko is said to come from the Japanese “renga” which means “brick”.
It is a type of range charts. The brick hight is a range the price must surpass, even by a pip or point, to start drawing a new block. The traditional Renko charts use the closing prices, and wicks are ignored. There can also be created, taking into account the high and low of every segment. TradingView does not have this modality, though, but it can show the wicks.
Price Action is Primary
Since the focus is on price movement, the time is secondary. A range can be travelled in seconds or hours, depending on market conditions and the range length. Renko and point and figure charts are very similar. P&F charts draw X and O stacked in columns while Renko charts use consecutive bricks.
Renko follows the price action, disregarding time. If the block is 5 points high and there is a price movement of 20 points in one second, the chart is suddenly populated by four new blocks. Then if the price action stops and keeps moving in a 4 point range for half a day, no new block is drawn.
This is kind of charting takes away the noise of the price movements and let the trader focus on the true “signal”.
Below, the EURUSD in both chart types. The first using the traditional candlestick OHLC 4H chart and the second one the same segment using Renko bricks.
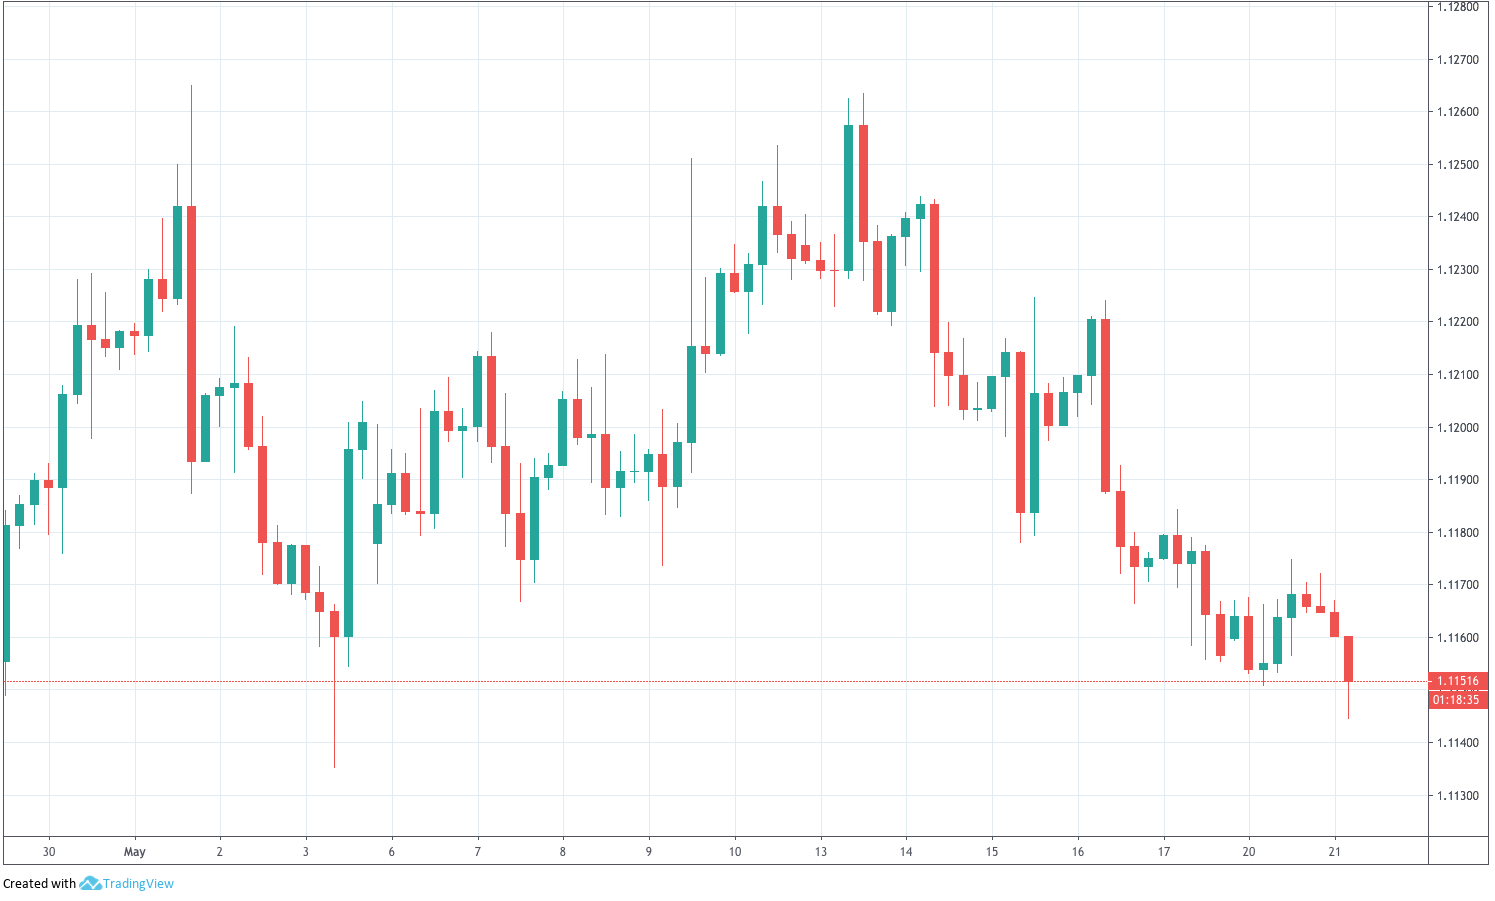
Chart 1 - Tradicional B&W EURUSD OHLC 4H candlestick chart
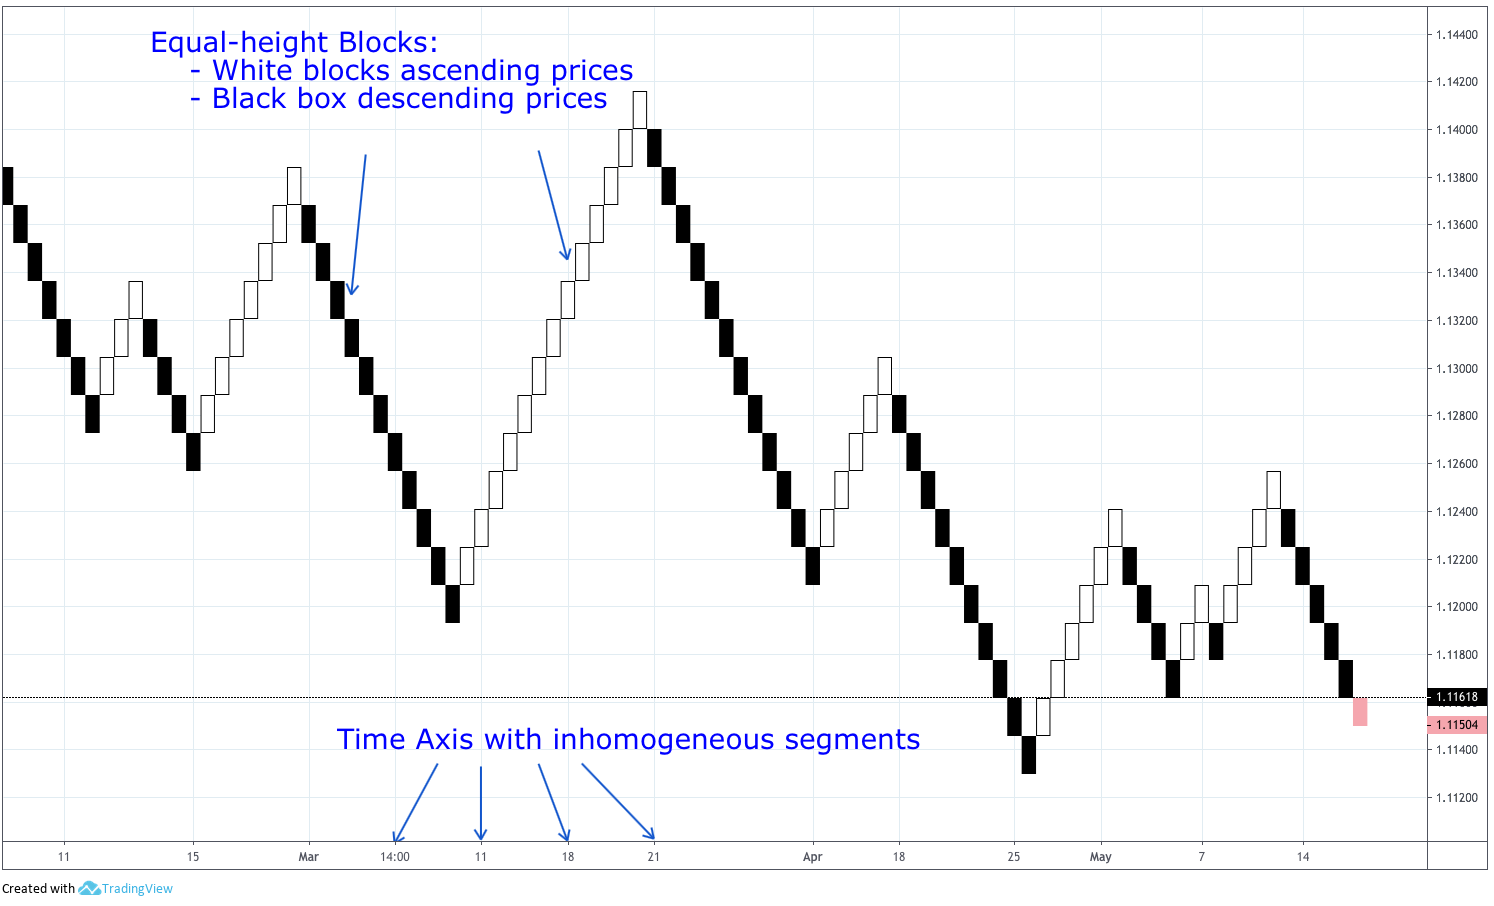
Chart 2 - Renko chart of the same EURUSD segment using 4H candlestick chart
Brick Types
On upward prices, the traditional Renko chart uses hollow or white bricks while descending prices are represented by black blocks. Modern charting software allows customising these colours.
Rules to brick placement:
- The bricks always touch each other by their corners
- Only one brick on each vertical column
Rues of Brick Construction
1.- Up Bricks: These are formed by price action above the previous block. The close has to end above or equal to the corresponding up-brick height level.
2.- If the price moves above during the corresponding bar’s time but closes below the new candidate brick’s height level the brick is not drawn.
3.- Down Bricks: These bricks are created by the price action below the previous brick. The close should be equal or below the corresponding down-brick level.
4.- If the price action during the allotted time of a bar moves below that level but fails to close at or below it, no new brick will show.
5.- If the price moves up and closes above the level required to draw one block, but below a second brick, only one brick is drawn. Viceversa for prices moving down.
6.- If the price moves with the size of several bricks, consecutive bricks should be drawn, until the remaining price movement no longer surpasses the last brick.
Fixed height or ATR Height?
Charting packages have two ways to compute brick height. The traditional invariant and pre-defined height and the new range-based height.
1.- Traditional brick height: New bricks are drawn only if the close price is larger than the pre-determined brick size.
2.- Average True Range (ATR): Uses the value of the Average True Range ( preset= 14 bars) to automatically adjust the brick height to the volatility of the market. The disadvantage is that if the ATR value changes, your chart are redrawn to reflect the new ATR value.
Basic Trading Techniques with Renko Charts
The Renko Chart, by itself, has only one trend-reversal situation: A brick with a different colour than the previous one. Therefore, if we rely solely on the chart without any additions, there are only two signals
A buy signal happens when a white block is drawn after a black one. The buy happens then at the closing price that may be higher than the top of the last brick. It can go two bricks up minus a tick or pip.
A sell signal happens when a black block is drawn, after a white block. The same situation as with a buy signal happens on sell signals. There is an uncertainty on the close price that may go as far as one tick above the next potential bearish block.
The figure below shows buy and sell signals on a EURUSD 4H Renko chart.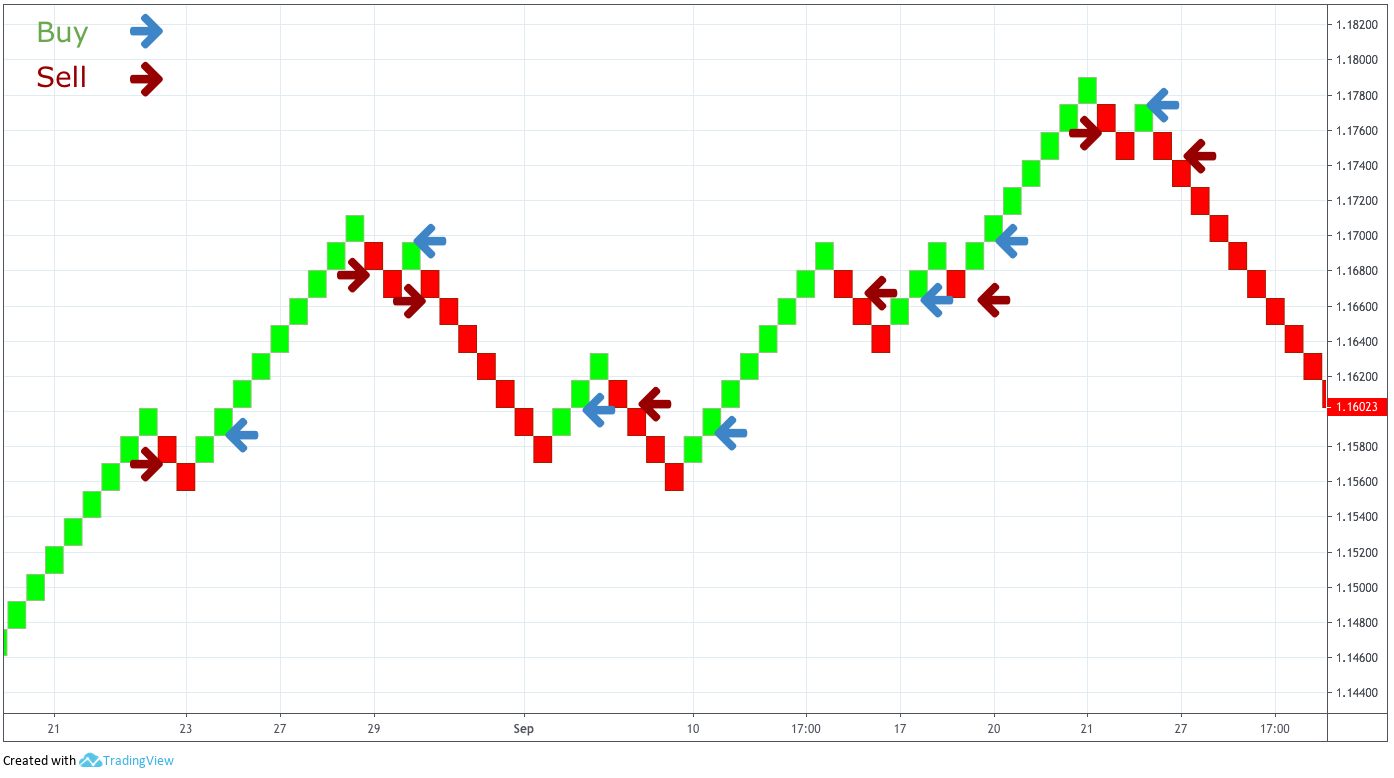
Chart 3 - EURUSD 4H Renko Chart showing Buy and Sell Signals
Using Renko charts this way is a trend-following strategy, therefore sometimes the trader may catch whipsaws as seen on this chart. Nevertheless, A well-chosen brick parameter and the nature of the Renko chart itself help reducing losses and have a long-term edge to the market.
Wicks
The wick is a very good addition to the traditional Renko chart. In the traditional candlestick chart, large wicks show usually in reversal or continuation bars. The beauty of wicks or shadows is that there is a high likelihood that the price action continues in the opposite sense to the wick. On Renko charts, due to the already high noise filtering the Renko does to the price action, the wick is a key confirmatory signal for the continuation or the reversal of the trend.
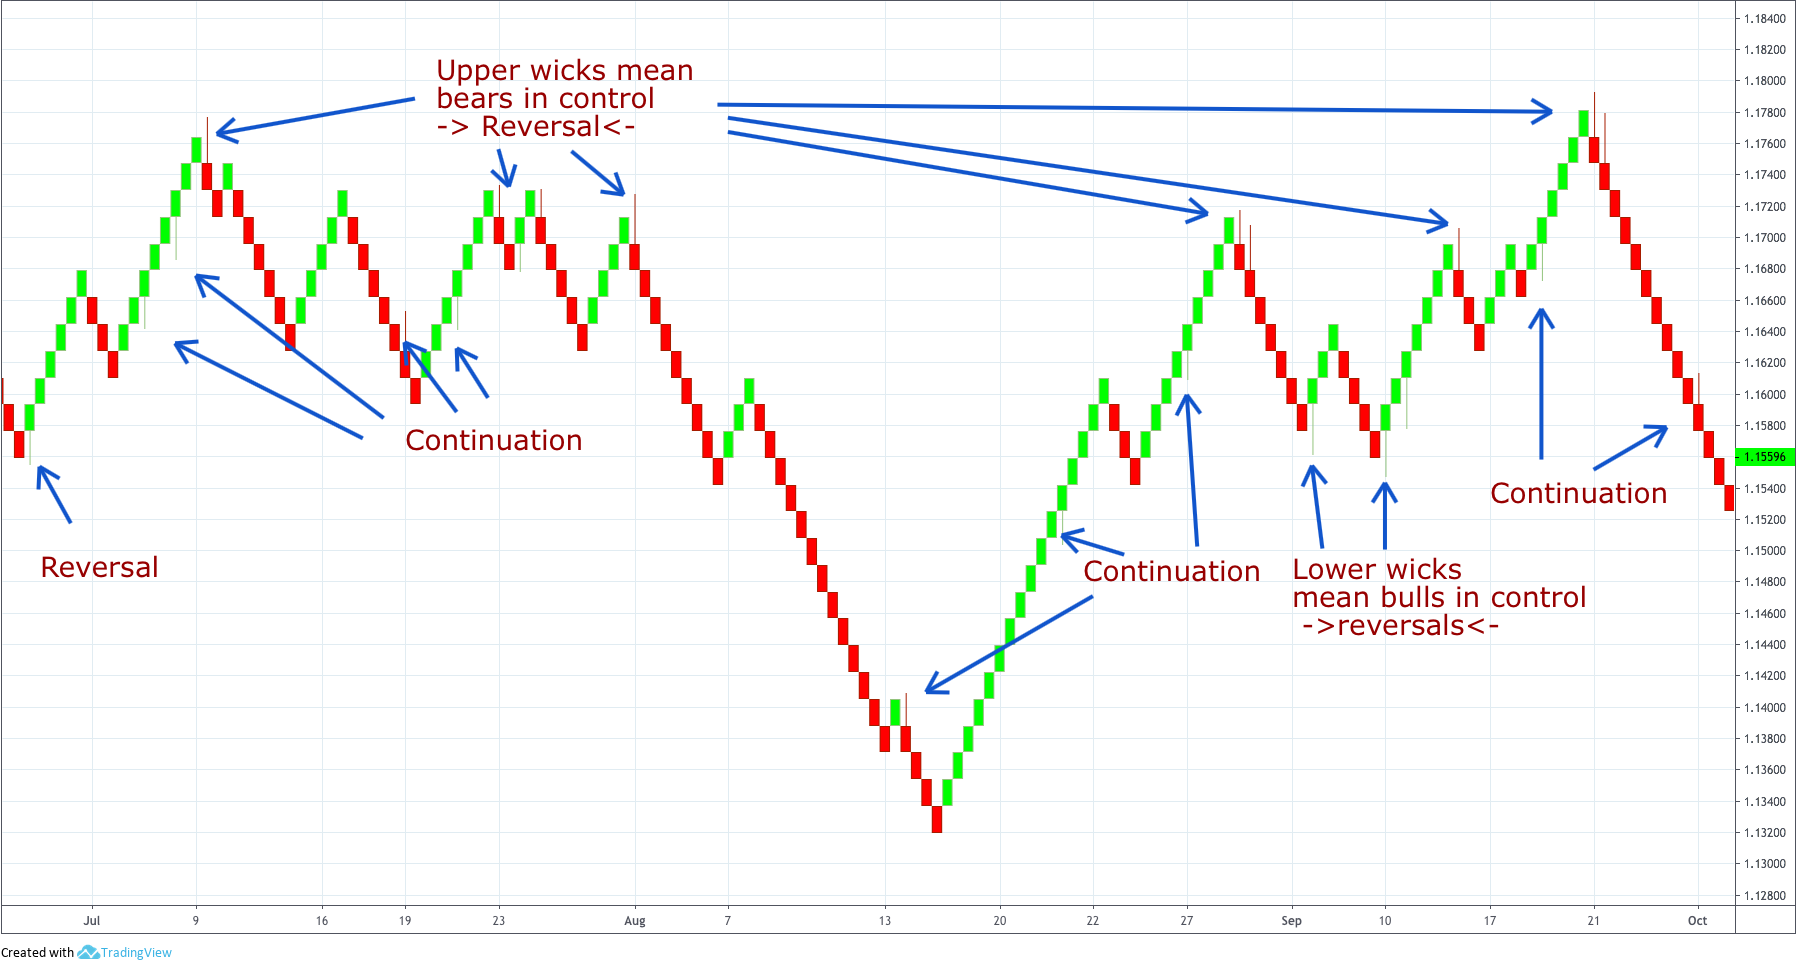
Chart 4 - EURUSD 4H Renko Chart with wicks shows the future direction.
In the above chart, we can see that most of the time the price action follows the direction opposite to the wick. That happens in reversals and also as continuation signals. This confirmatory sign is very useful, especially, to verify a reversal.
Support and Resistance
Renko Charts are very visual to display obvious support and resistance levels. When a trader draws horizontal lines just on top of the lowest brick of a descending trend, not only the support zone is shown, but a break above this level usually shows that the previous breakdown was false. This, in turn, signals the long entry point to catch the new leg up.
Conversely, if the price moves up and then breaks the horizontal line to the downside shows the fake break of the resistance level and signals a good short entry.
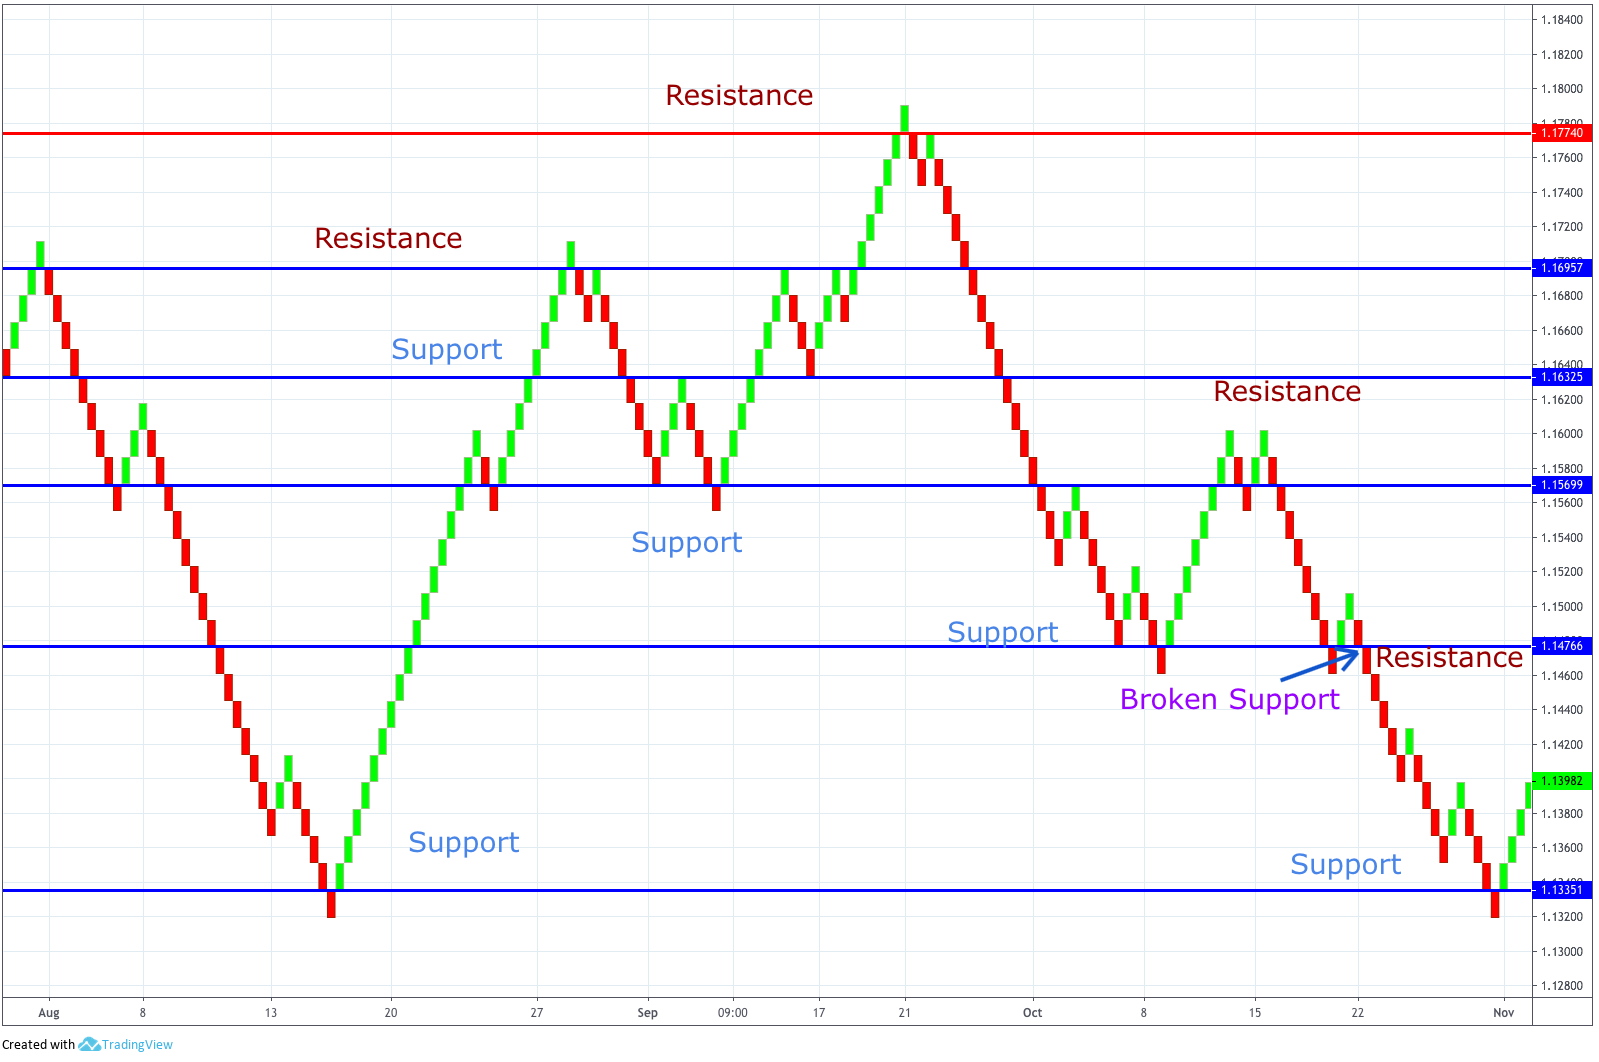
Chart 5 - EURUSD 4H Renko Chart showing support and resistance levels
Moving Averages on Renko Charts
A moving average can be added to a Renko chart. But the price averages will be computed using the Renko bricks, not the actual bars could be hidden inside the bricks. Therefore Shorter period averages are more common because the propper Renko technique is filtering out most of the market noise already.
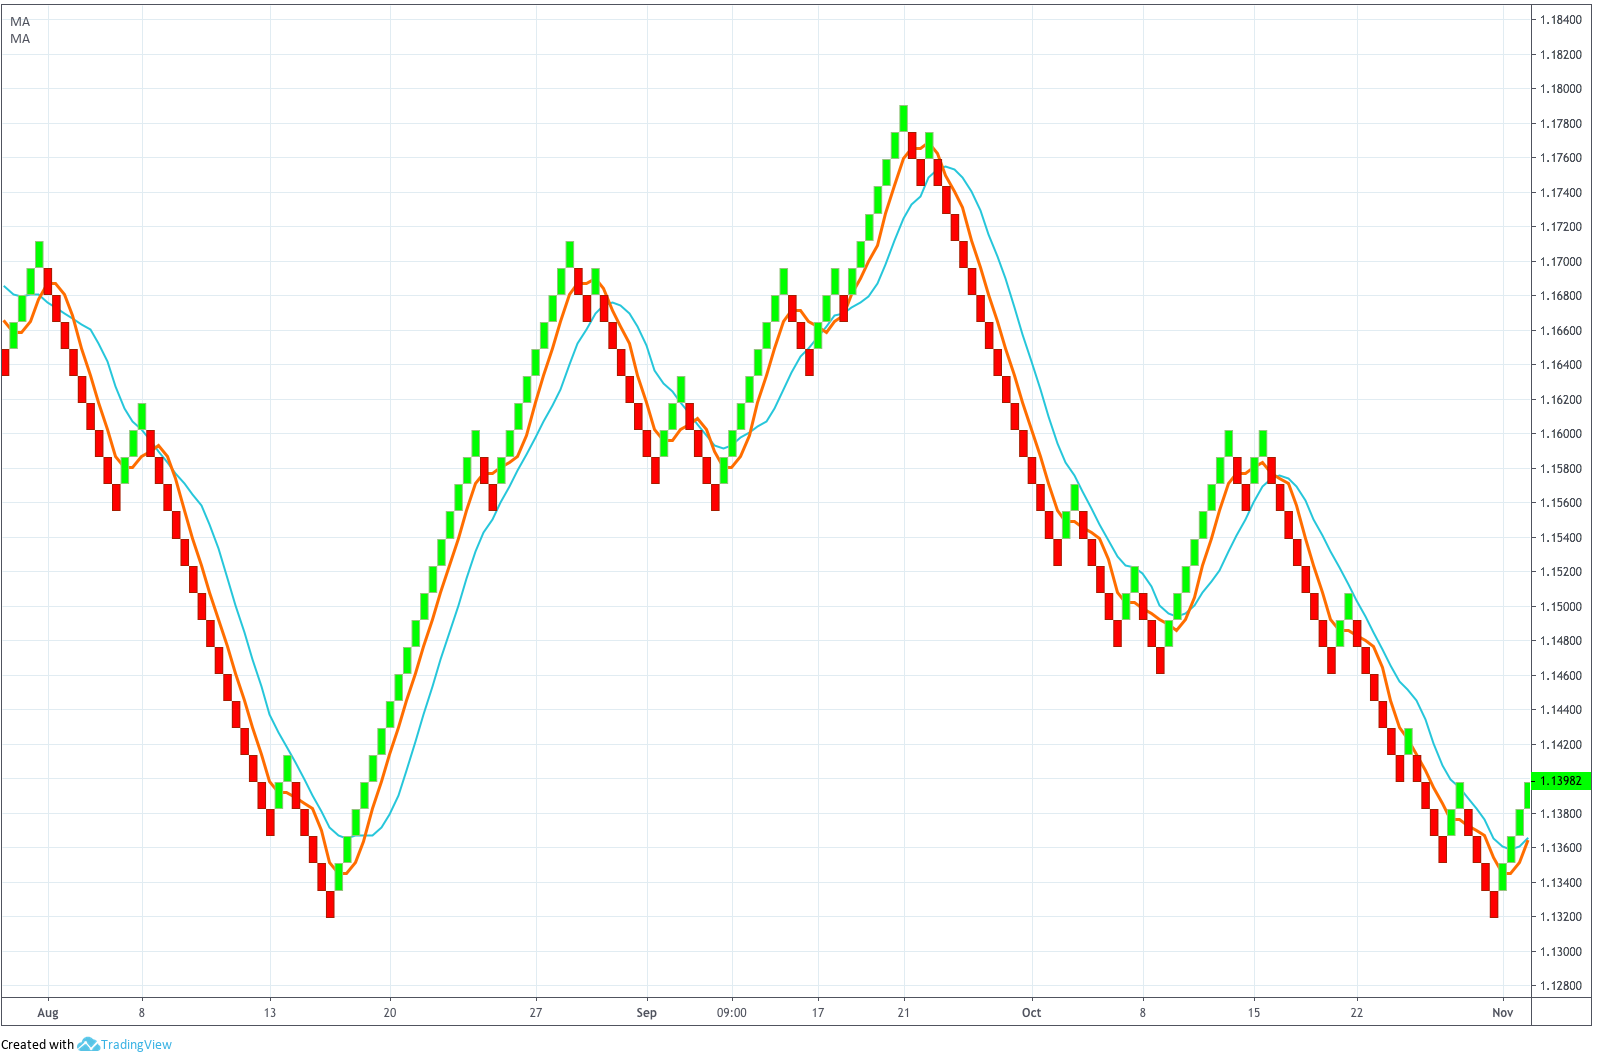
Chart 6 - EURUSD 4H Renko Chart With 5 and 10-brick Simple Moving Averages
Above we see a two moving average crossover strategy using 5 and 10-brick periods. We can see that it is very close to just doing price action by taking brick reversals, but the MA crossover help the trader avoid some small price reversals against the trend.
Renko chart and the Stochastic indicator
The technique is to take the trade if the Stochastic Indicator confirms the action. That mean taking sell signals when a crossover of the Stochastic lines happen near an overbought condition and buy signals in oversold conditions unless there is a crossover of the indicator in the direction of the main trend.
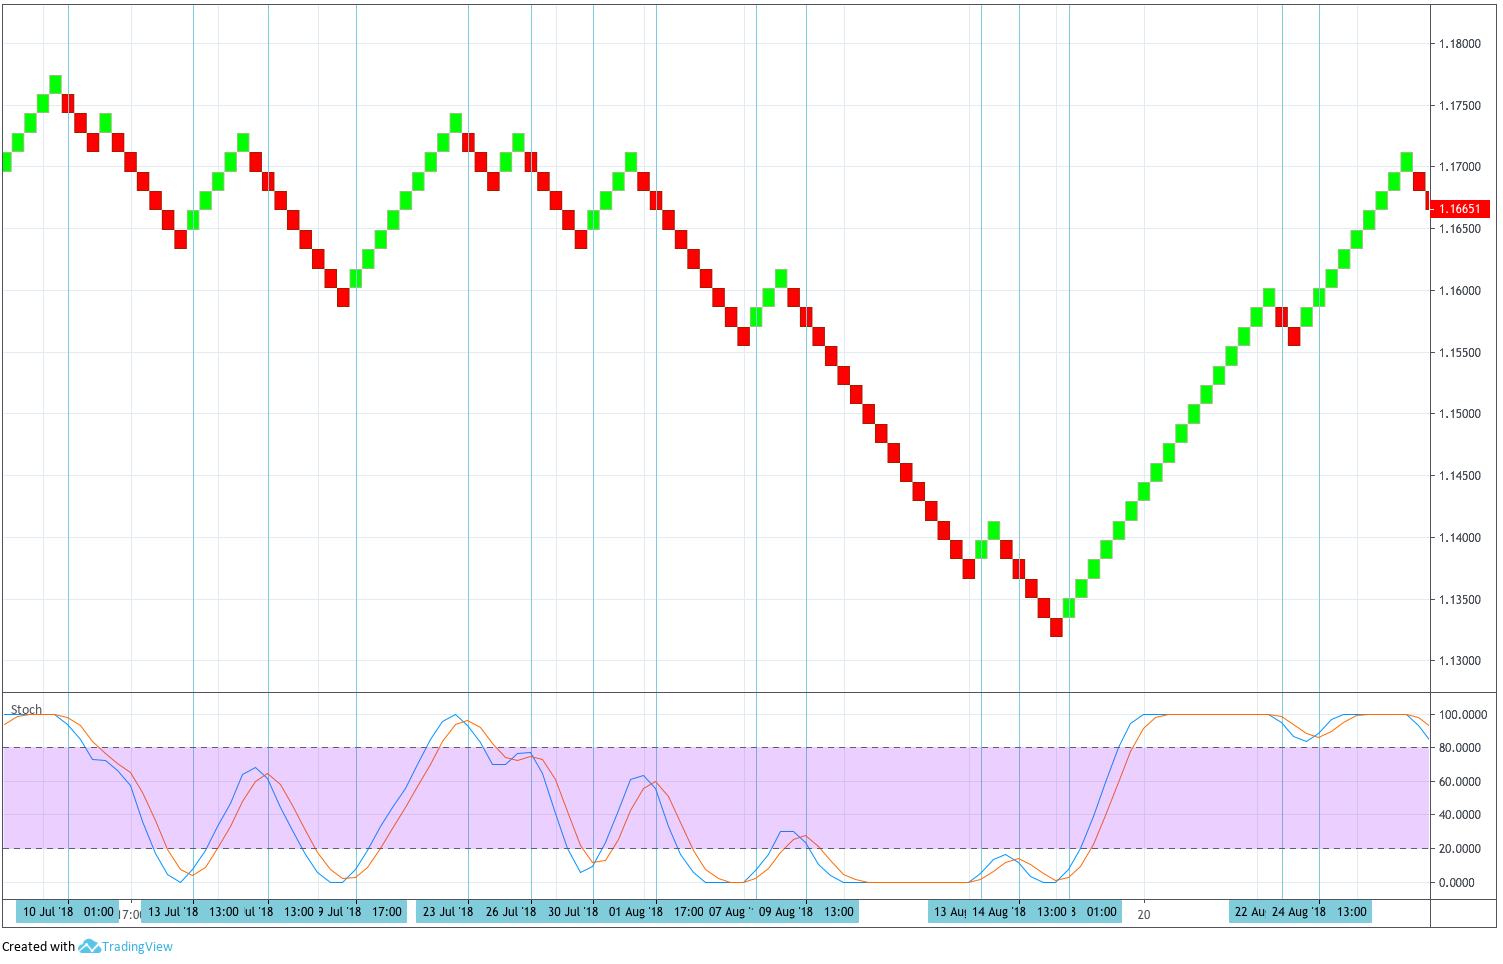
Chart 7 - EURUSD 4H Renko Chart With Stochastics
Conclusions
Renko charts are a cleaner presentation to detect trends.
Especially suited for beginner traders who still are struggling with technical analysis.
Renko Charts can be used alone or with the addition of other technical studies.
The most simple of the additions to Renko are support and resistance lines. Also, trend channels can be drawn. This will help the price action trader to take decisions and filter out undesired trades against the trend, solely based on the information of breakouts or failed breakouts.
The application of a Moving Average or an MA crossover is also helpful to filter out unprofitable trades against the prevailing trend.
The use of a cyclic indicator such as the Stochastics indicator can help the trader choose or filter determined trades under oversold or overbought situations. Another cyclic oscillator such as the RSI may fit as well.
The downside of Renko charts, as shown in the reference, below is that reversals are quite far apart from price, therefore you should play safe with your trade size.
Reference: Steve Nison has a handful of pages dedicated to Renko charting in his book Beyond Candlesticks.
Stockcharts.com has a nice Renko charts tutorial
This site here shows an article on the dark side of Renko. Maybe you should read it too.
