

What is “Relative Vigor Index Indicator”?
Relative Vigor Index Indicator is a leading trading oscillator. RVI is a momentum indicator that gauges the strength of the trend.
How does “Relative Vigor Index Indicator” work?
The key factor of the RVI indicator is that prices tend to close higher than the opening price in an upward trend and close lower than the opening price in a downward trend. Higher values for the RVI point out booming the strength of the trend, while lower value indicates a weakening of strength. When the buying trend gains momentum, traders anticipate the RVI value to rise. The indicator of making negative and positive values by jumping above and below zero values. The image below shows the two lines red and green, which create the RVI indicator.
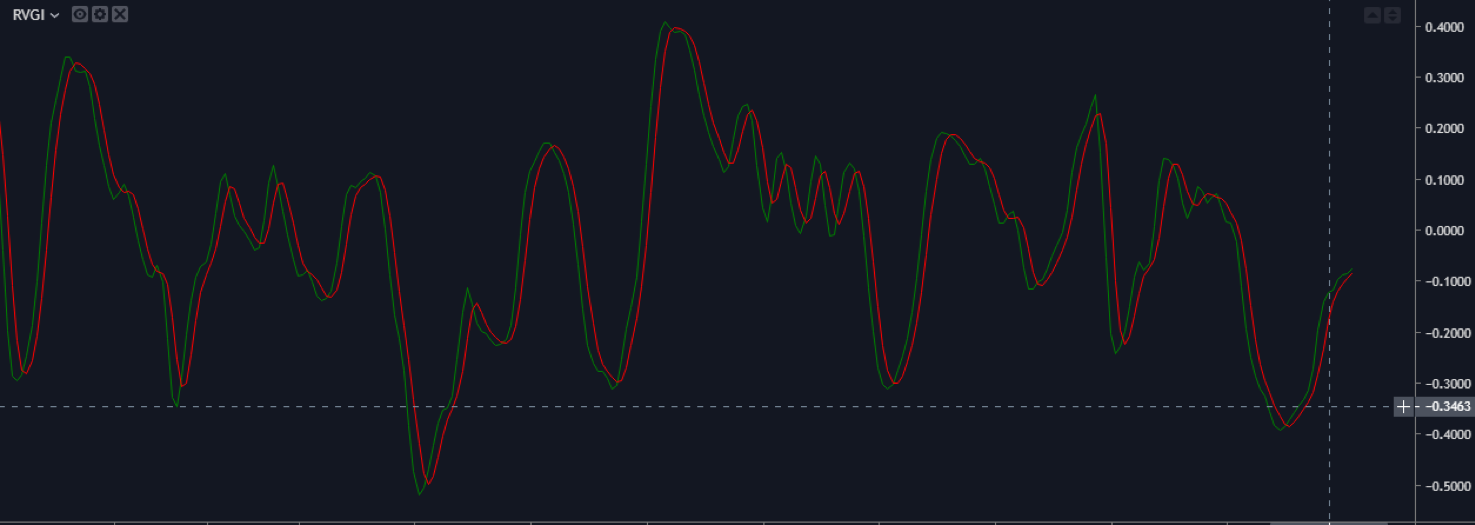 Image 1 - The Relative Vigor Index Curves - Click on the image to enlarge
Relative Vigor Index Formula
RVI = (Close – Open) / (High – Low)
- Open – Open Price.
- Close - Close Price.
- Low – Low Price.
- High - High Price.
Change of Settings Advisable for Relative Vigor Index Indicator?
The Relative Vigor Index indicator is made up of two lines, the “Green” line, which is the standard moving average RVI values, and the “Red” signal lines which interact with each other and gives the buying and selling signals to traders.
Green Lines and Red Lines
Green Line
The green line is a standard moving average of the RVI indicator. The default value of the green line is 10 – periods, but traders used it in multiple ways to maximize their profits. Most of the traders change the default value to some of the common 7,9,14 periods, which gives them the smooth ride in the market.
Red line
The red line is a “trigger line.” It is a 4-period volume-weighted moving average, and it provides trade signals when it crosses above or below the standard moving average green line.
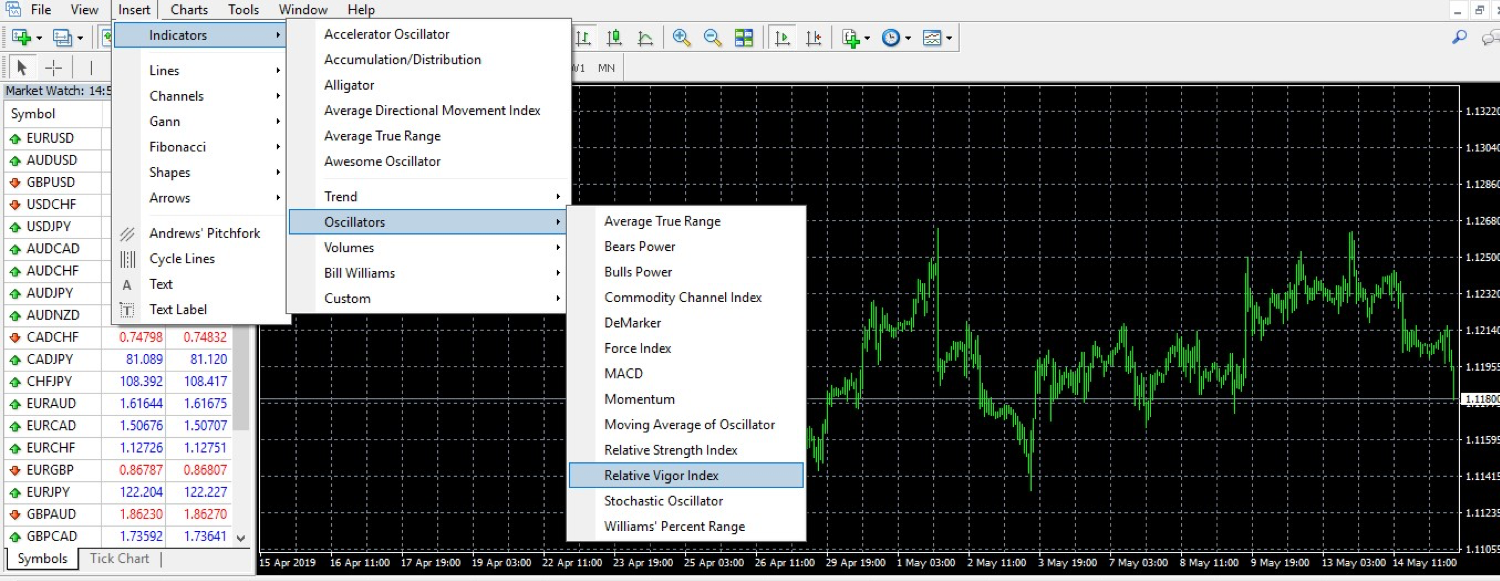
Step by step process of Installing “RelativeVigor Index Indicator”
RVI indicator is a standard Meta trader indicator. Most of the brokers provide this indicator in their terminal. So, if you use MT4 then by default this indicator is available in your terminal, you need to follow some simple steps to make this indicator your own.
As shown in the image below:
Open your MT4 terminal then click on the Insert first-row third column and there will be a couple of indicators available select the Oscillator, another box will pop up and click on the Relative Vigor Index.
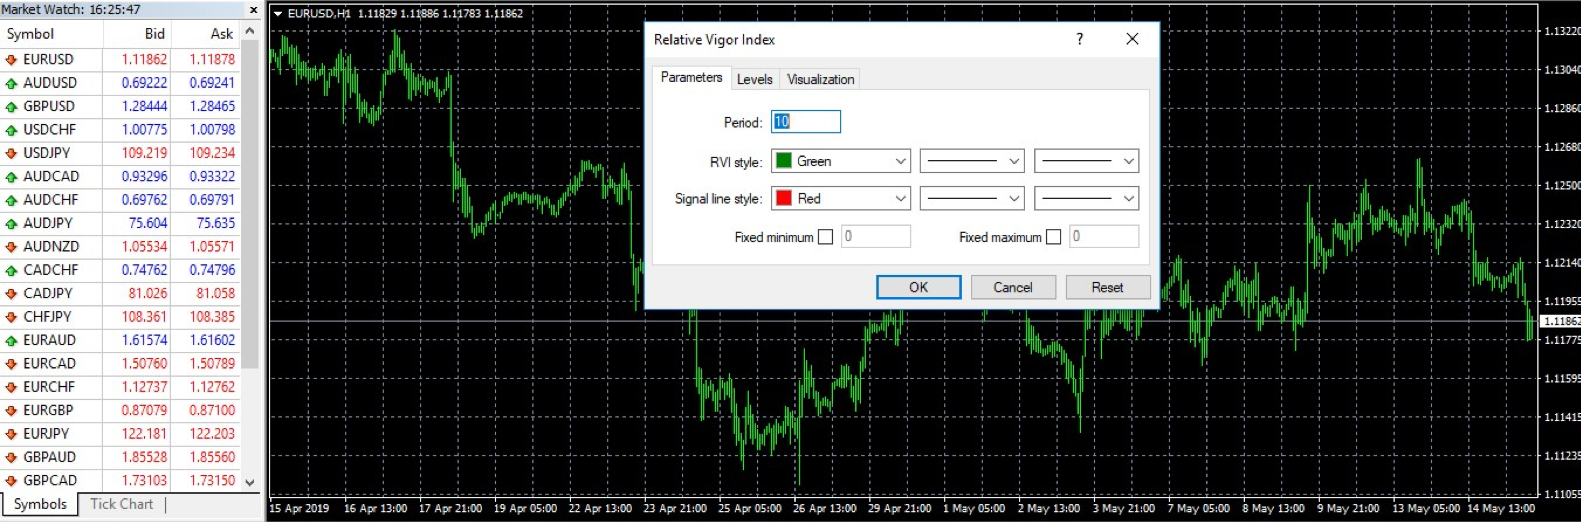
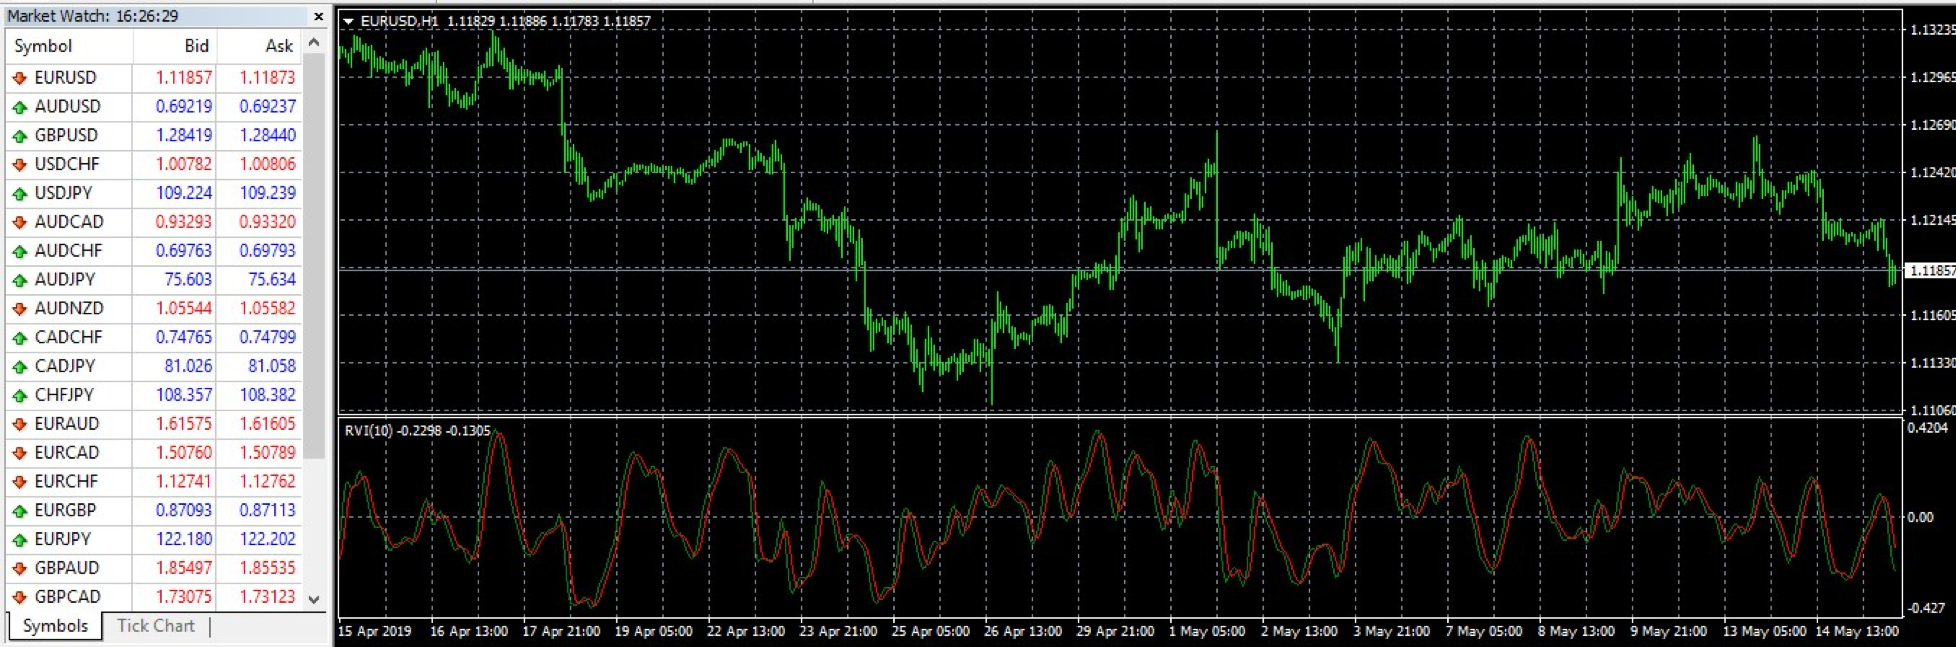
When you click on the RVI, you will see a prompted small box, which shows you some of the parameters where you can easily change the period according to your trading style. By default there will be a green SMA line and RED trigger line, You can also choose the colour of your choice for these lines. In the image below, you can see the RVI indicator applied to a 60-minute EURUSD chart.
Pros and Cons of “RelativeVigor Index Indicator”
PROS
The main advantage of using the RVI indicator is the fact that it is the leading indicator. RVI indicator is a program founded on the mathematical formulas and economic data of the various sources, which helps the traders to choose the trades.
The most common default setting for the RVI indicator is 10 periods, and the most significant advantage traders have to select the periods according to their own trading style.
The common periods which we suggest you are 7,9,14,21 and 25 and the more, the higher the number of periods traders choose there’s a less chance of “whipsawing’’ but the down part of the highest periods is traders get the less amount of trades in the market.
Like most of the indicators, RVI is also worked best in the trending market, and also it can combine with divergence, some other indicator, supply and demand, support and resistance, candlestick patterns it gives the unshakable solid edge to the traders. For the higher timeframe traders, RVI is a holy-grail because the higher timeframes maintain strong trends, and the RVI generates the more powerful signal which gives the great opportunity to the traders for trading with the trend.
CONS
Relative Vigor Index Indicator usually respond to the market changes slightly later than the actual move takes place. If you use higher periods, then it even takes more amount of time to give a signal.
The major problem with the RVI is it generates false signals in range-bound markets, and during the highly volatile market, RVI generates many signals. However, trusting on volatile market signals are too dangerous because as the price action suddenly shifts its direction and RVI generates so many signals in a shorter amount of time which makes it difficult for the traders to believe on the signals.
Strategies Using The Relative Vigor Index Indicator
Traders can build various trading strategies however using the“Relative Vigor Index Indicator” Some of the strategies are below:
Buy Entry Setup Rules
Timeframe doesn’t matter, first of all, wait for the uptrend, and the RVI indicator should cross 0.0 level from lower to the upper portion. Now bring momentum indicator into the play and wait for the momentum indicator to cross 100 level from lower to upper. After the RVI cross 0.0 level and momentum indicator cross 100 level, then you need a bullish candle. After getting the strong bullish candle place a buy entry and ride the trend.
Sell Entry Setup Rules:
Again, Timeframe doesn’t matter our strategy works on each timeframe. So first of all, wait for the downtrend and the indicator should cross 0.0 level from upper to lower portion. Now bring another indicator into the play, which is momentum and wait for the momentum indicator to cross 100 level from upper to lower portion. After the RVI cross 0.0 level and momentum indicator cross 100 level, you need a bearish candle. After getting the strong bearish candle place a sell entry and ride the trend.
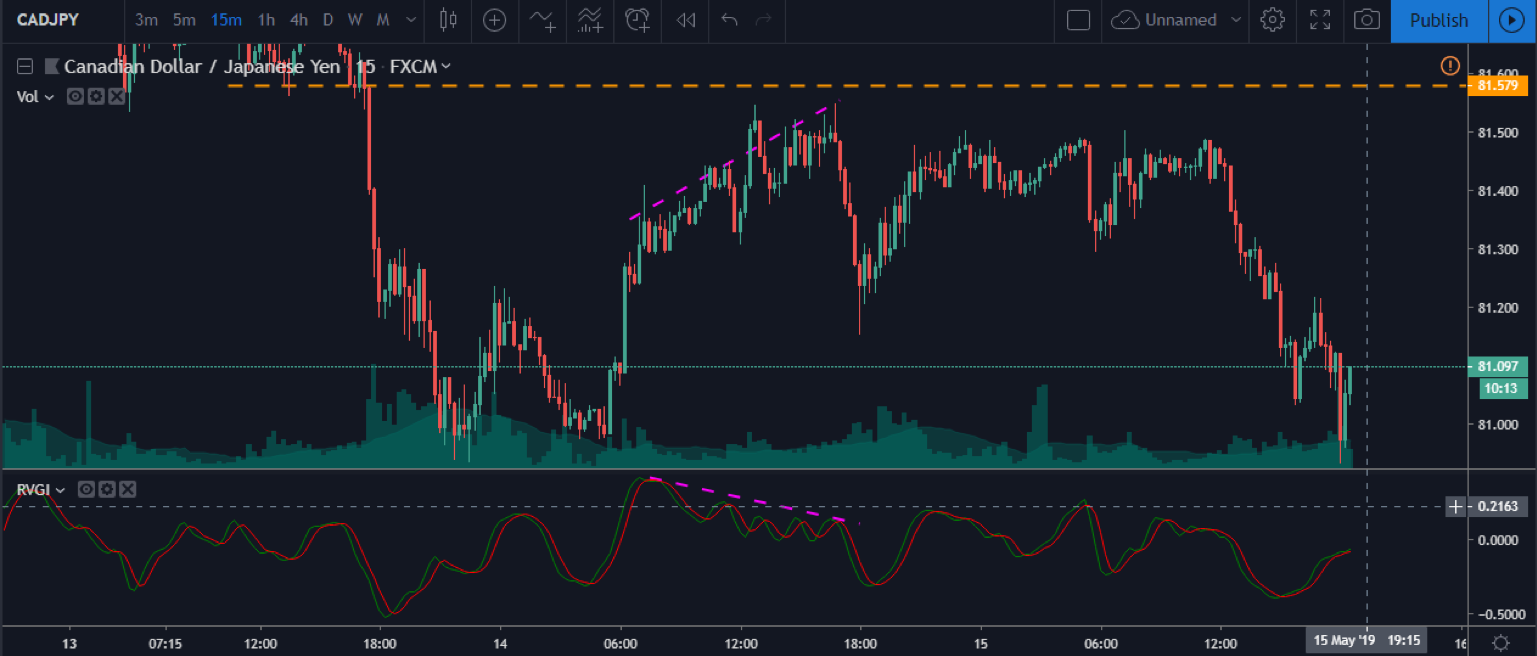
Use Divergences to Find the Perfect Entry
Divergences are a great way to find the trades into the market and divergence also have a higher Success rate, sometimes in the market price prints the new high and low but the RVI keeps going against the trend that shows us that markets are going to exploit for the short term. Below you can see a bearish divergence forming on the CADJPY 15 minute timeframe, with the green signal line at 18:00 giving the perfect entry for a nice trend reversal.
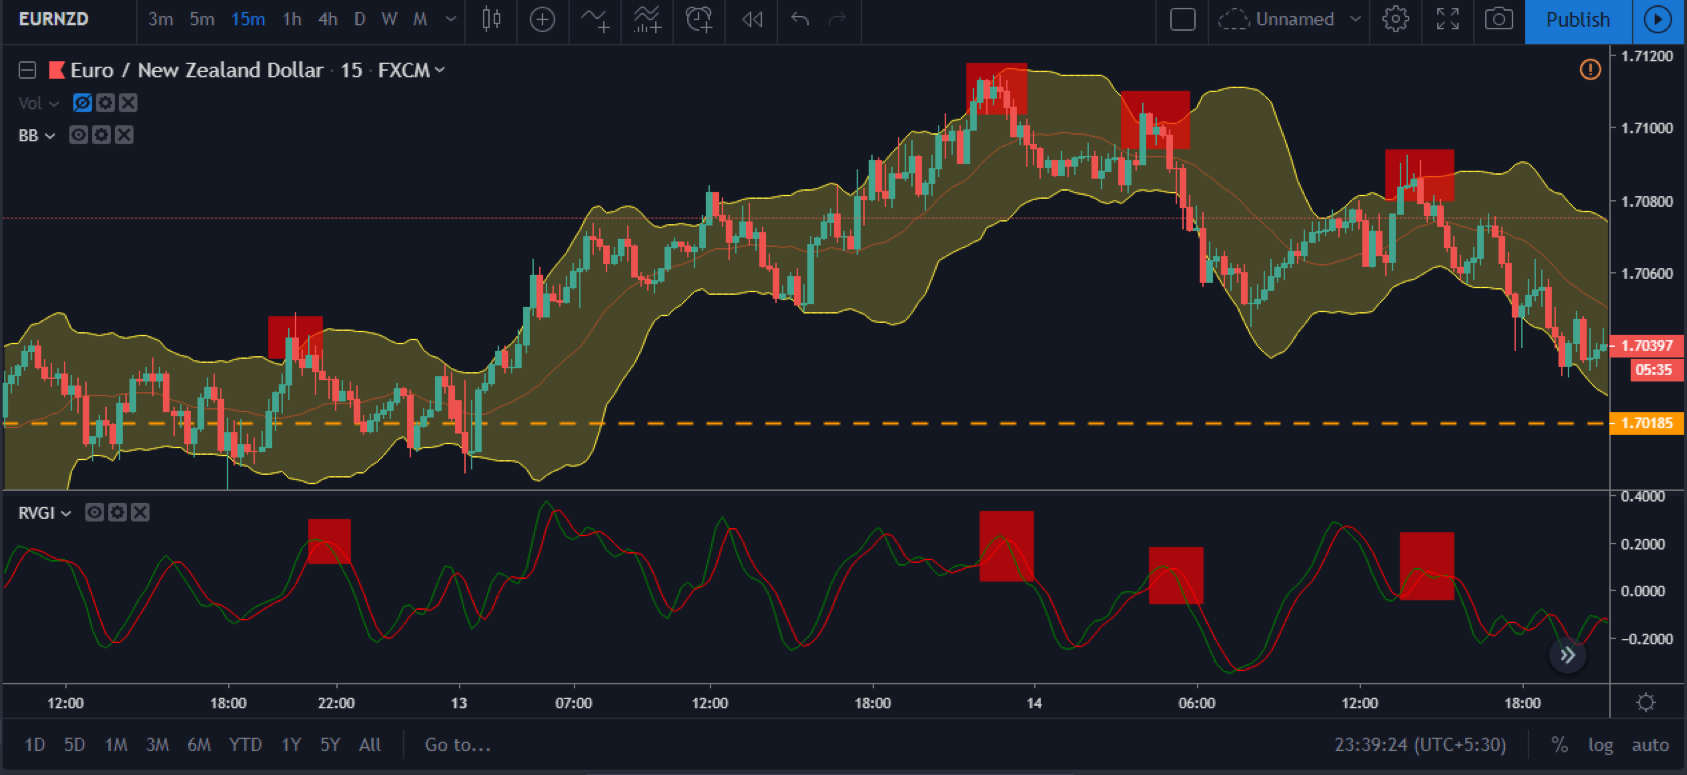
Relative Vigor Index and Bollinger Bands
Another secret strategy that many pro traders use is the combination of Bollinger Bands and RVI. Bollinger bands aka clouds consist of simple moving average { 20 periods SMA } with two colourful lower and higher clouds. So the strategy is when the Bollinger band hit the upper cloud, and at the same time, RVI red line cuts the green line and both of the indicator confirming the sell signal and traders targeting the middle Bollinger band.
Conclusion
RVI is a leading indicator that works beautifully in the trending markets. It consists of two lines, Green and a red line that interact with each other and generate buy and sell signals. Additional indicators will dramatically improve the traders’ decision makings. It smooth and cut clear signals on the higher timeframes. We believe that this article helps you in your trading journey, and by now, you clearly understood how to use the RVI indicator to maximise your profits.
References.
https://admiralmarkets.com/education/articles/forex-indicators/relative-vigor-index-indicator
https://www.investopedia.com/terms/r/relative_vigor_index.asp
https://www.metatrader5.com/en/terminal/help/indicators/oscillators/rvi
All images are taken from the Metatrader 4 Application.
