Bar Anatomy
A bar is a summary of what happened in a time lapse on a graph. Time lapses vary from one minute to a month in the classical MT4 trading station, but other sophisticated platforms can go down to ticks and up beyond months.
It has just four price values: Open, High, Low and Close.
These four values are the main moments of the interval. The Open price, the highest and the lowest prices, and the last price (Close), summarised in four letters: OHLC
As we already said, bars can be created using different time frames. Using a Metatrader 4, from minutes to a month. A longer time frame bar can be constructed using shorter time frames. 5-minute bars from 1-minute bars, for example. Moving from short to long timeframes is easy: The Open, High, Low and close of the longer period is taken from, the shorter period.
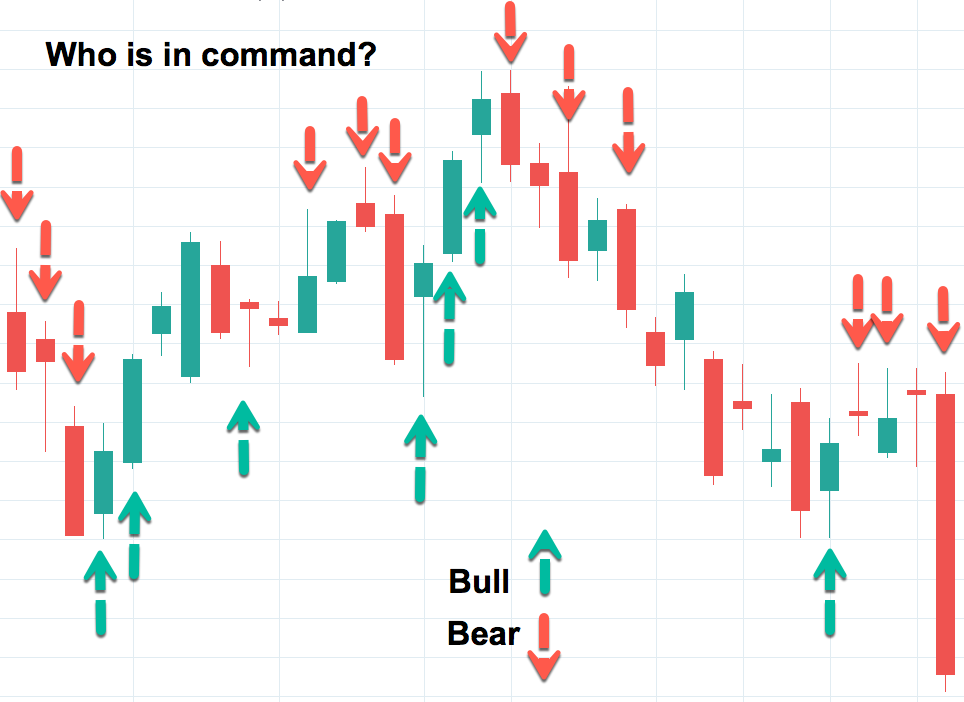
Who is in command?
The relation between the Open, High, Low and close create patterns that allow an astute observer to determine the driving sentiment of that time lapse and also who was controlling the price. That can easily be seen using candlestick charts.
Corrective candles mean small body and large shadows. When the body of the candlestick is tiny, with small tails or wicks, nobody won. When there is a large tail to the upside, and a close near the bottom of the range it means there was a fight but finally it was won by the bears. If the tail is below the body and the close is near the top of the range the bulls won.
On impulsive candles the victory is evident: It was won by the side who has imposed the closing price.
Single Bar Patterns
Just a single bar is able to display a lot of information. Price changes during the bar’s period reflect the dominant beliefs of traders during that time lapse.
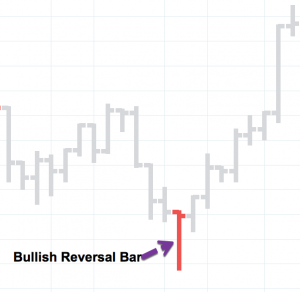
Reversal Bar
A Reversal bar closes in the proximity of its open, but with a high or low far away from the open and close. This bar pattern outlines what might be two opposing bars at a smaller timeframe.
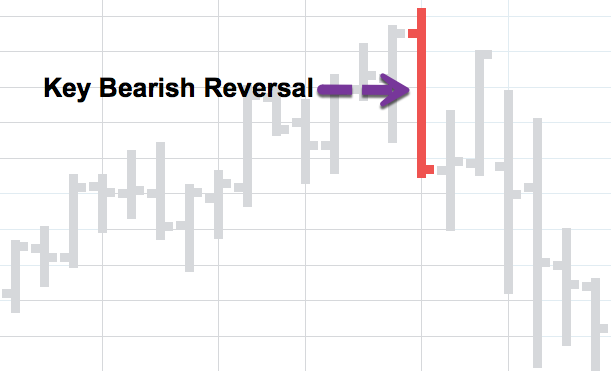
Key Reversal
This is a reversal bar that wipes the price action of the previous bar, therefore it involves two bars. It may be thought of as a reversal bar on a shorter time frame.
The Key Bullish Reversal Bar shows the Open below the Close of the previous bar and its close above the previous bar’s high. The specular pattern happens on Key Bearish Reversal bars.
This is a strong confirmation that the bear sentiment has ended and a bull leg is beginning. Key Bearish Reversal bars are the specular pattern to this one.
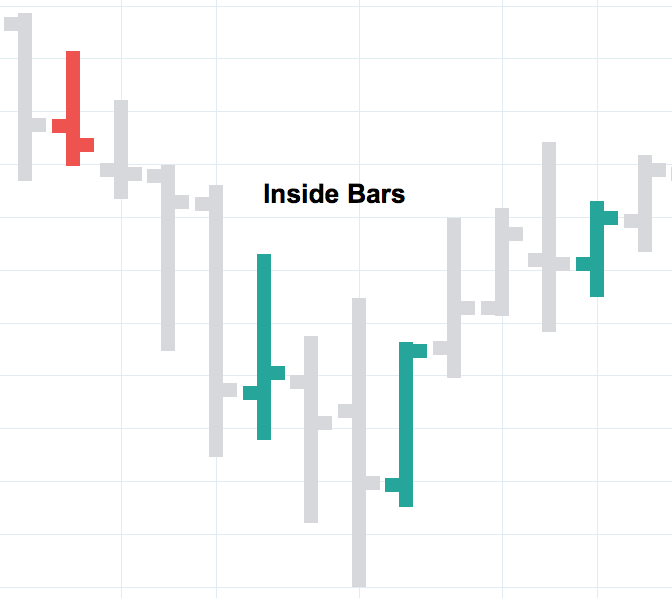
Inside Bar
An Inside bar is a bar whose action moves entirely inside the previous bar. It is a contraction of volatility. Several of them together can restrain the price in a horizontal channel. Usually, Inside bars are corrective movements of a previous impulse.
Outside Bar
An Outside bar Is a bar whose range, from High to Low surpasses the range of the previous bar. It shows an increase in volatility. Outside bars tend to be impulsive, although not always.
Exhaustion Bar
Exhaustion bar: A bullish Exhaustion Bar opens with a gap down, then moves up and closes near the high, showing a long body. This usually happens with a high volume.
The gap may not get filled at the close, but when there’s a lot of strength it gets filled as well. The Exhaustion Bar and its volume confirmation are signs of the end of a bearish trend. The Bearish Exhaustion is the specular version of this pattern. It starts with a gap up and, then moves to the downside with a large black body.
Conclusions
The shape of the bar is the result of the price action, which is the product of the market sentiment. Therefore, the bar form a pattern that reflects the psychology of that moment in time.
If we see a large segment and the close and open are together at one of the extremes of the range, we should suspect of a reversal.
Engulfing candles, such as key reversals are similar structures as the reversal bar if we move to higher timeframes.
Inside bars reflects the struggle between opinions and is a corrective structure that shrinks the volatility.
Outside bars are expansions in volatility that may signal a continuation or reversal of a trend.
Exhaustion bars, with large volume, shows the final selloff or buying frenzy that ends a trend and starts a new one.