

SMA Crossover Strategy with a twist
Currently, traders use moving averages to smooth the price noise. An average behaves as a filter, removing the fast price changes, considered as noise. Its smoothness is determined by the period. A three-period SMA acts in just three periods, while a 200-period SMA uses the last 200 price values to compute values.
Simple Moving Average(SMA):
The simple moving average is computed as the sum of all prices on the period and divided by the period.
SMA = Sum( all prices in the period)/period
A moving average presents the mean price over a time window. The average is a good approximation of price. Different windows will show different values. The resulting values can be considered a consensus of price during that period.
Then, if we observe two consensuses, one long-term and the other short-term, and the short-term agreement moves above the long-term one, we might conclude that the current opinion about the price is changing, so, it’s a good time to buy. The opposite holds when the short-term average moves below the longer-term one.
If the two periods are wide apart, such as a 10-period SMA and a 100-period SMA, we can consider the slow SMA as a long-term bias of the price and the fast SMA as a provisional drift of the price from its centre. Under that assumption, we can think that when the fast MA is wide apart and starts heading back to the slow SMA prices are over-extended. When the fast SMA starts moving in the same direction as the slow one, we know the corrective movement has ended and a new impulsive leg is possible.
First attempt: SMA crossovers
Buy if the fast-MA crosses over the Slow MA
Sell if the fast MA crosses under the Slow MA
Let’s analyse the parameter space. The MA crossover strategy has only two parameters: The fast-MA period, and the Slow-MA period. To accomplish this, We use a simulator on a EUR-USD 15-min chart over a 14-year minute data set. We simulated the returns using a constant one-lot trade, and the result is shown in the figure below. We go long when the fast MA crosses over the slow MA and price is above the fast MA. The opposite holds for short positions.
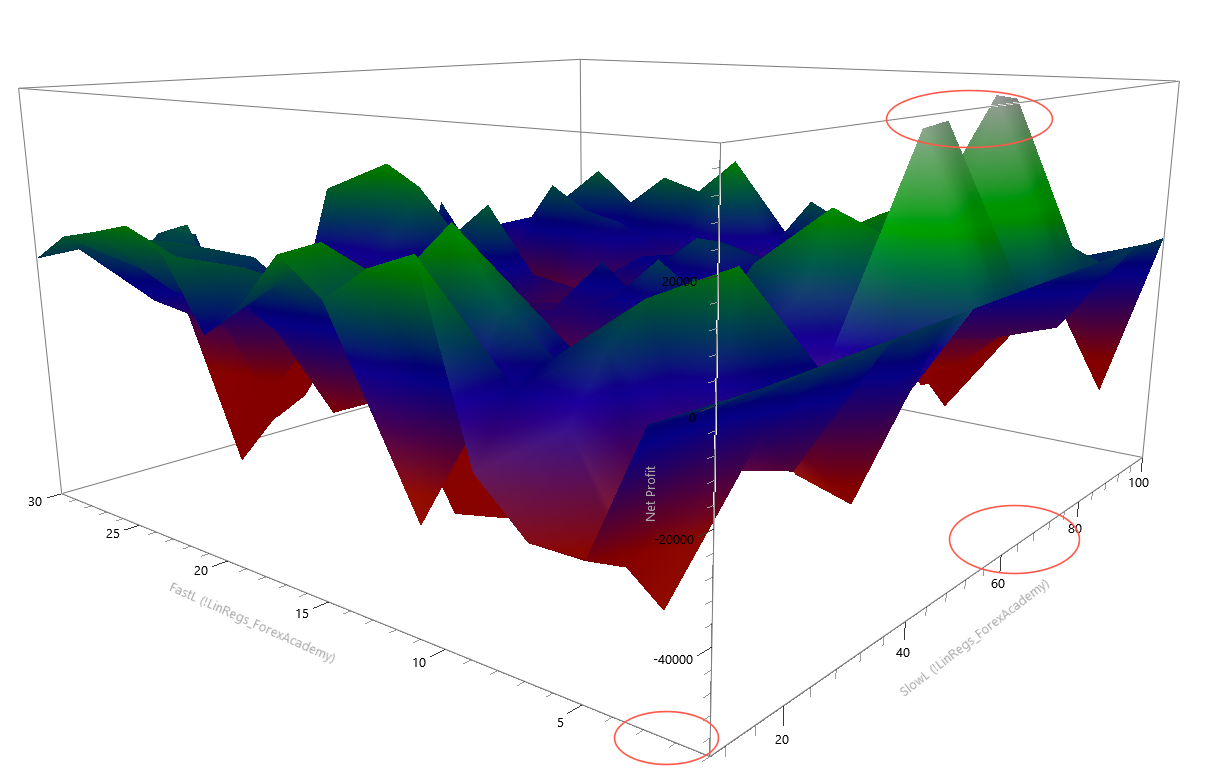
We can see that the surface is not smooth. That is not good. It means a slight parameter change has large consequences to the performance of the strategy. We see that the best performance is obtained with a slow-MA in the range of 60-70 and less than five bars for the fast MA.
There is another fact: Only 48 out of 304 simulations deliver positive results. This demonstrates that this entry strategy is questionable as is. I have seen some people promoting a trading system that goes long when the 5-period MA crosses over the 10-period MA, and short on opposite crosses. This strategy loses 32,000 Eur at the end of 14 years ( below its equity curve)
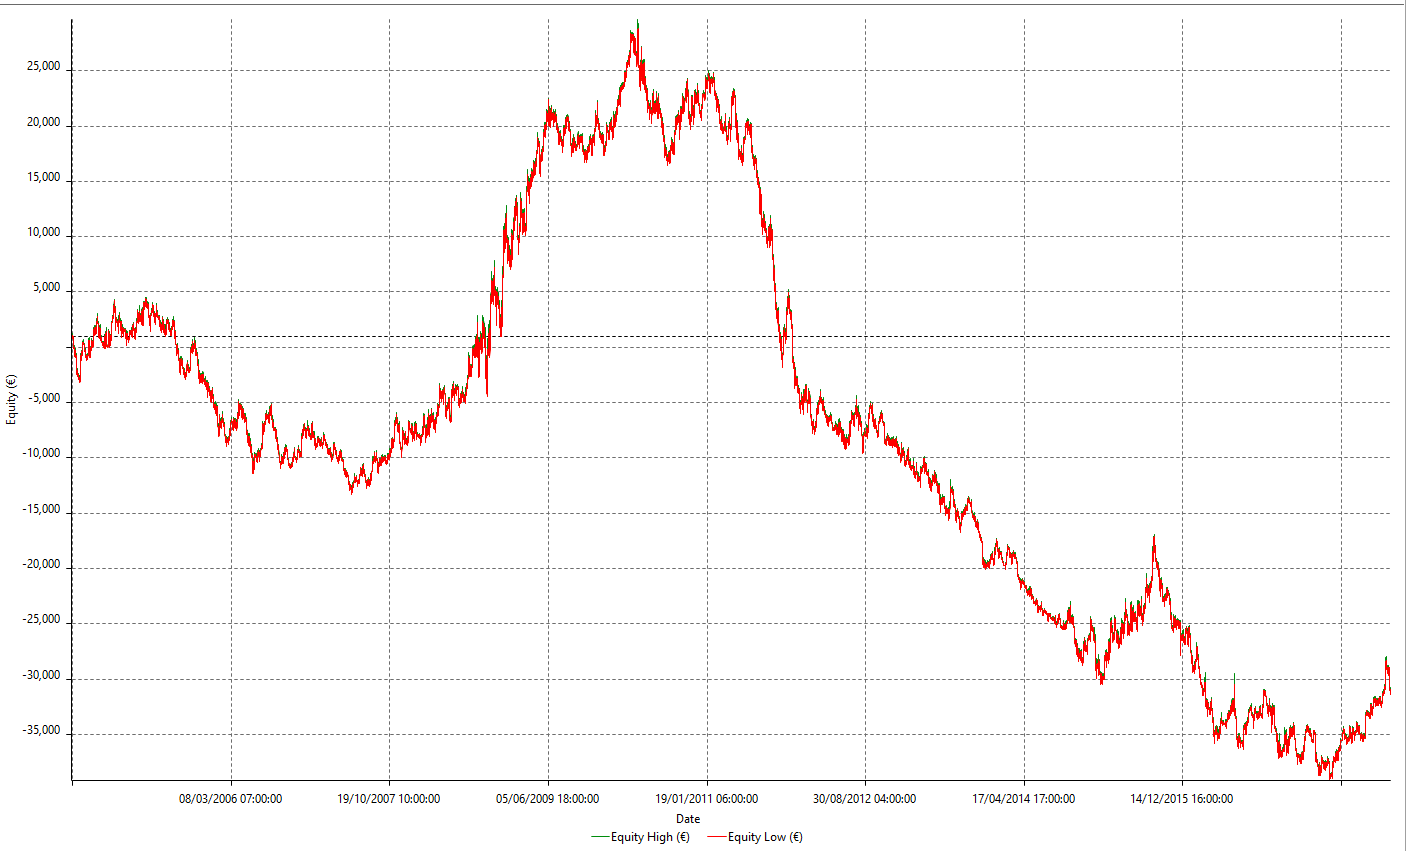
The use of trail-stops and targets can make this strategy positive, but the equity curve is hopelessly untradeable:
So what may help to improve this strategy?
Well, I thought about two ways. The first one is to move the slow MA to the 70.
That is a good improvement, we have large losing periods, but this MA changed the strategy for the better.
What would happen ( my second idea), if we add the condition that the slow MA should be pointing UP and prices above the slow MA?
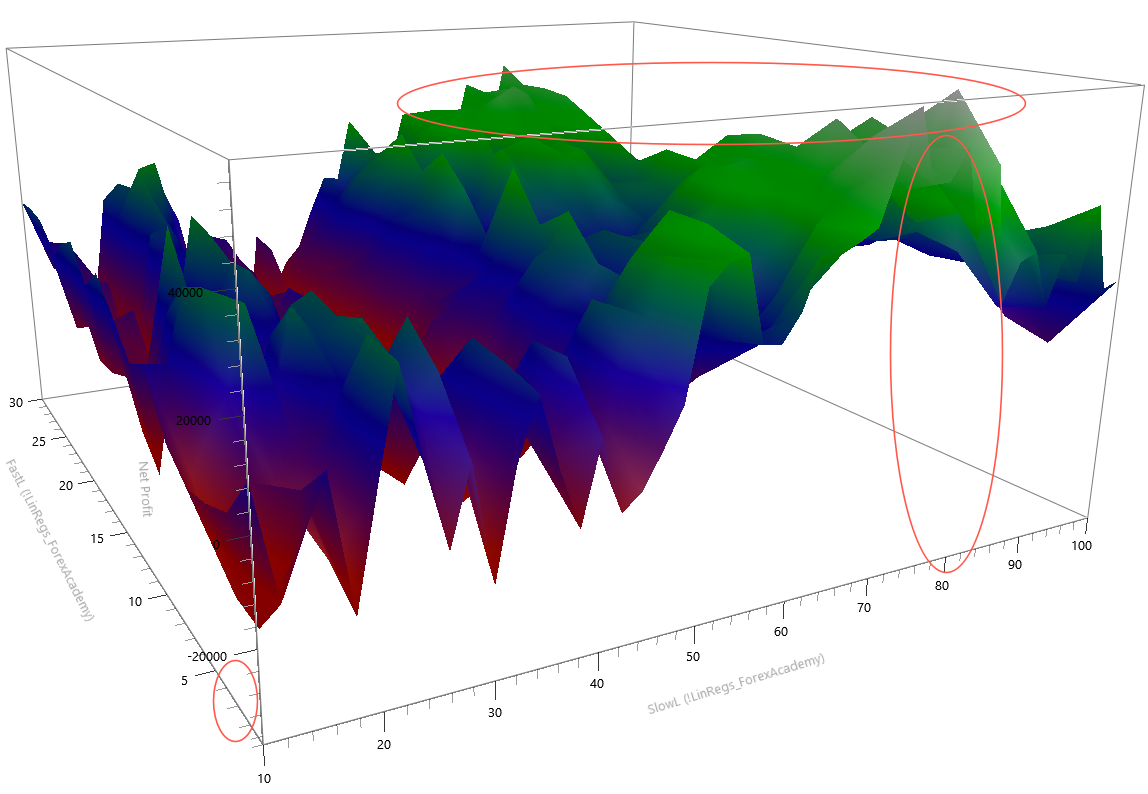
When performing an optimisation map using these rules, we observe that best values are using slow-MA periods around 80 bars. The fast MA period stays at less than 5.
Another thing we see is that the parameter surface is smoother around 80 periods. This is a sign that we’ve found the right place for our parameters.
Finally, in this simulation, 500 out of 735 simulations show positive results. That shows us that we have found a more robust strategy because 80% of the parameter values deliver positive outcomes.
Thinking about it what the strategy tells is this:
The Slow SMA establishes the main trend.
The fast SMA detect when the movement against the trend is over and enters when its slope aligns with the slope of the slow SMA.
So, that will be the basis of our moving average crossover strategy.
The Rules of the strategy:
Periods: Slow MA: 75, fast SMA: 3
Initial Stop-loss: 0.18%. This mean, we cut our losses if it crosses 0.18% away from our entry price.
Trailing stop-loss: 0.38%. We let the trade room to catch the trend.
Long entries:
1.- A Bull market happens when the Fast SMA crosses over the Slow SMA
2.- Long positions allowed only when the slow SMA points upward, meaning its current value is higher than its previous one.
3.- We buy when the price closes above the Slow SMA.
Short entries:
1.- A Bear market happens when the Fast SMA crosses under the Slow SMA
2.- Short positions allowed only when the slow SMA points downward, meaning its current value is smaller than its previous one.
3.- We sell short when the price closes below the Slow SMA.
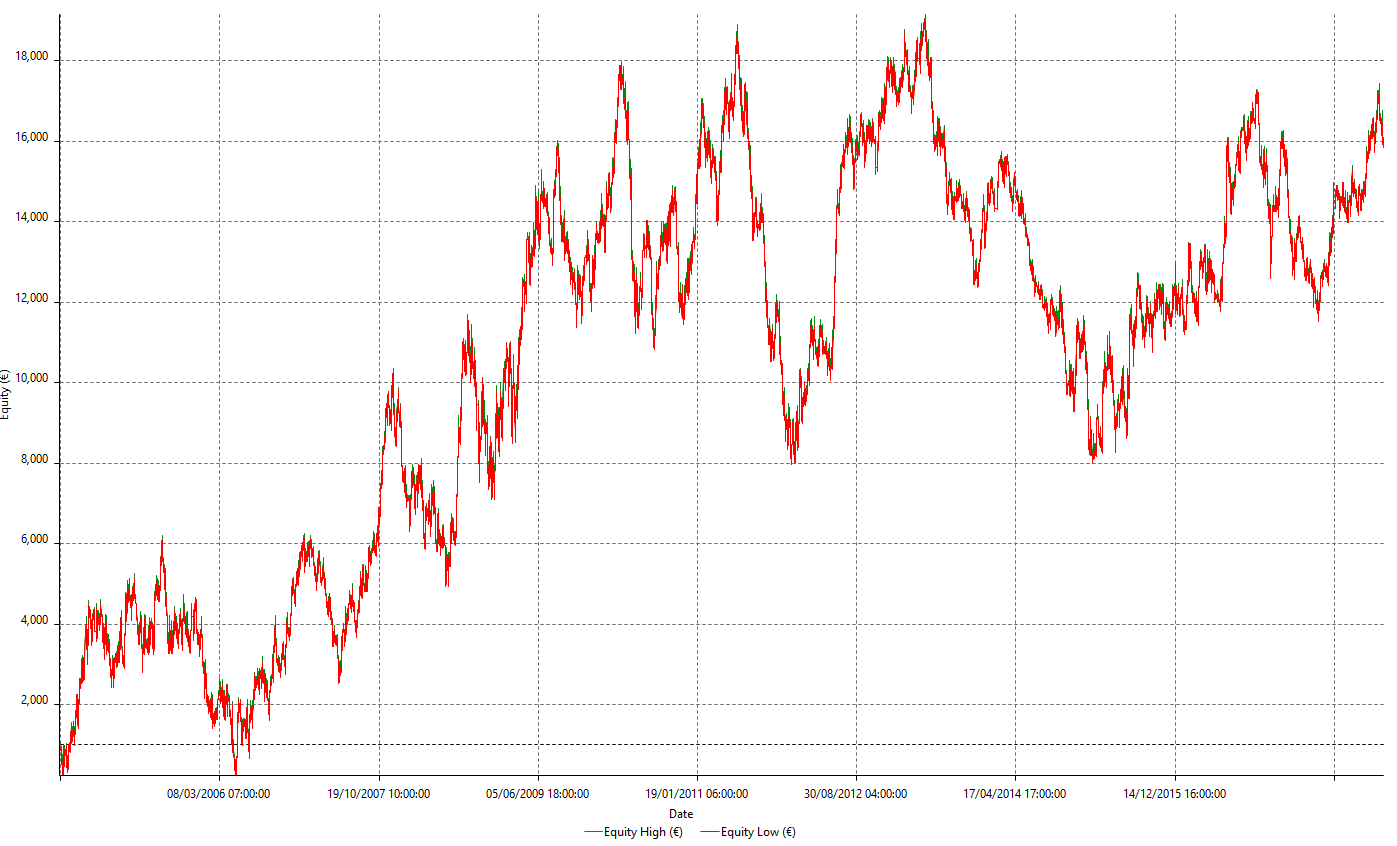
The equity curve is much better, although it shows the typical equity curve of a trend-following system.
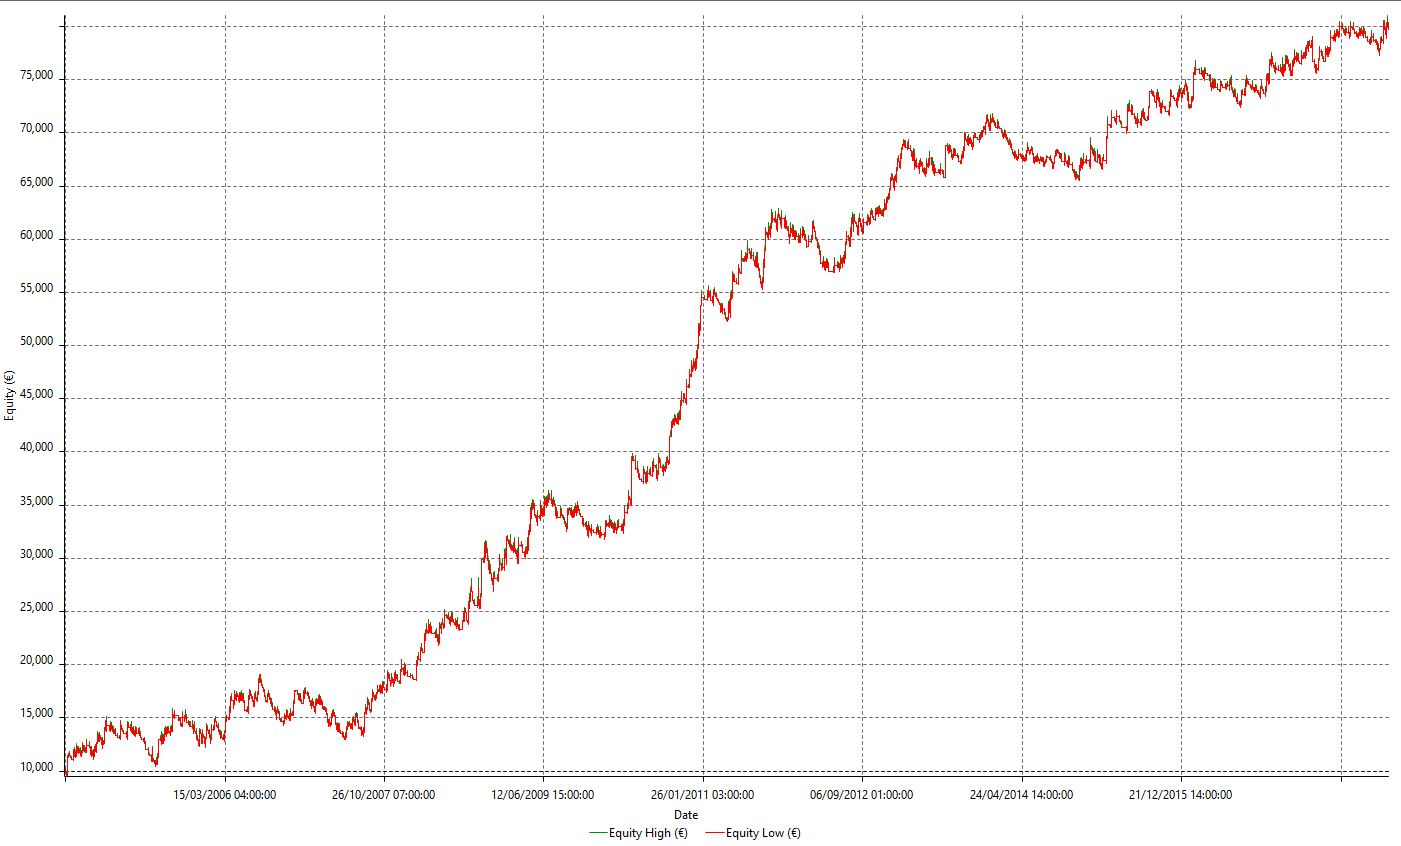
Total Trade Analysis shows why. The system’s per cent winners are 27.33%, and the reward-to-risk ratio is 3.5 (Avg Win/Avg Loss ratio). That tells the system is robust, by priming profitability over the frequency of winners, but it is not a system for all kinds of people.
From time to time we should expect a streak of up to 20 losing trades, therefore we need to apply proper money management.
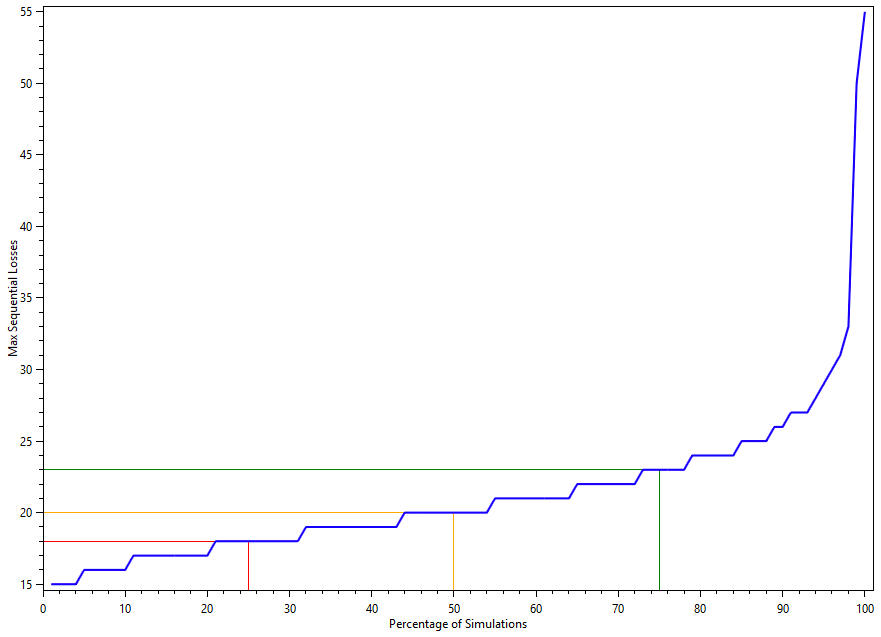
As an example, let’s say, you don’t like to have a drawdown higher than 25% of your running capital, then you need to divide that figure by 20, and that must be your maximum risk for a single trade, therefore, in this case, this is about 1% of the current capital allocated for this strategy.
The Answer
The answer to this question is “probably not”. Most traders will lose money using MA crossovers. It takes a special kind of trader to believe in a system that, from time to time, presents 20 losses in a row.
