
1.- Trading Calendar
Every evening you must analyse the economic news releases and Central Bank speeches related to the assets you’re going to trade. The reason of that is that YOU MUST MARK THE RELEASE TIME in your electronic calendar using an alarm 10 minutes before the event, AND STOP TRADING WHEN THE ALARM RINGS.

The reason is that Economic Releases are too risky to trade for a new technical trader. That is so because at these moments technicalities are worth nothing. Volatility spoils everything and all technical signals fail.
After the release, you have to analyse how this specific event has affected the different assets in your basket. It is common that an event marks a new trend or reinforces the one in existence, at least for a couple of days. You do not need to understand why. Just annotate the fact. You can see the effect on the price and that will tell you all.
One caveat, though. Do not rush to conclusions. Let volatility settle before deciding about a new trend.
A good calendar for your needs is found here:
https://tradingeconomics.com/calendar
What to look for on the calendar?
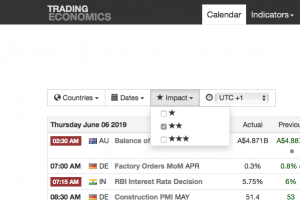 Economic Calendars can be filtered by importance. Select medium (two star **) to watch medium and high impact events.
Follow the market wrap every morning on this site for our comment about key news and events, as well.
Image credits: Tradingeconomics.com
2.- A Basket of assets to trade
A successful trader needs a basket of assets to watch every day. That way he will familiarise with how they move and how they correlate.
The key features such a basket need are:
Liquidity: All assets on the basket needs to be actively traded. You should avoid exotic pars. Centre your attention on Major pairs and crosses.
Diversification: When 90% of the currency pairs involve the US Dollar it is difficult to create a diversified basket, but it can be done.
Trendiness: The asset is desirable to show a trend in the timeframe you’re going to trade. Non-trending markets can be profitable, but if they move in wide channels, so we see trending legs to profit from.
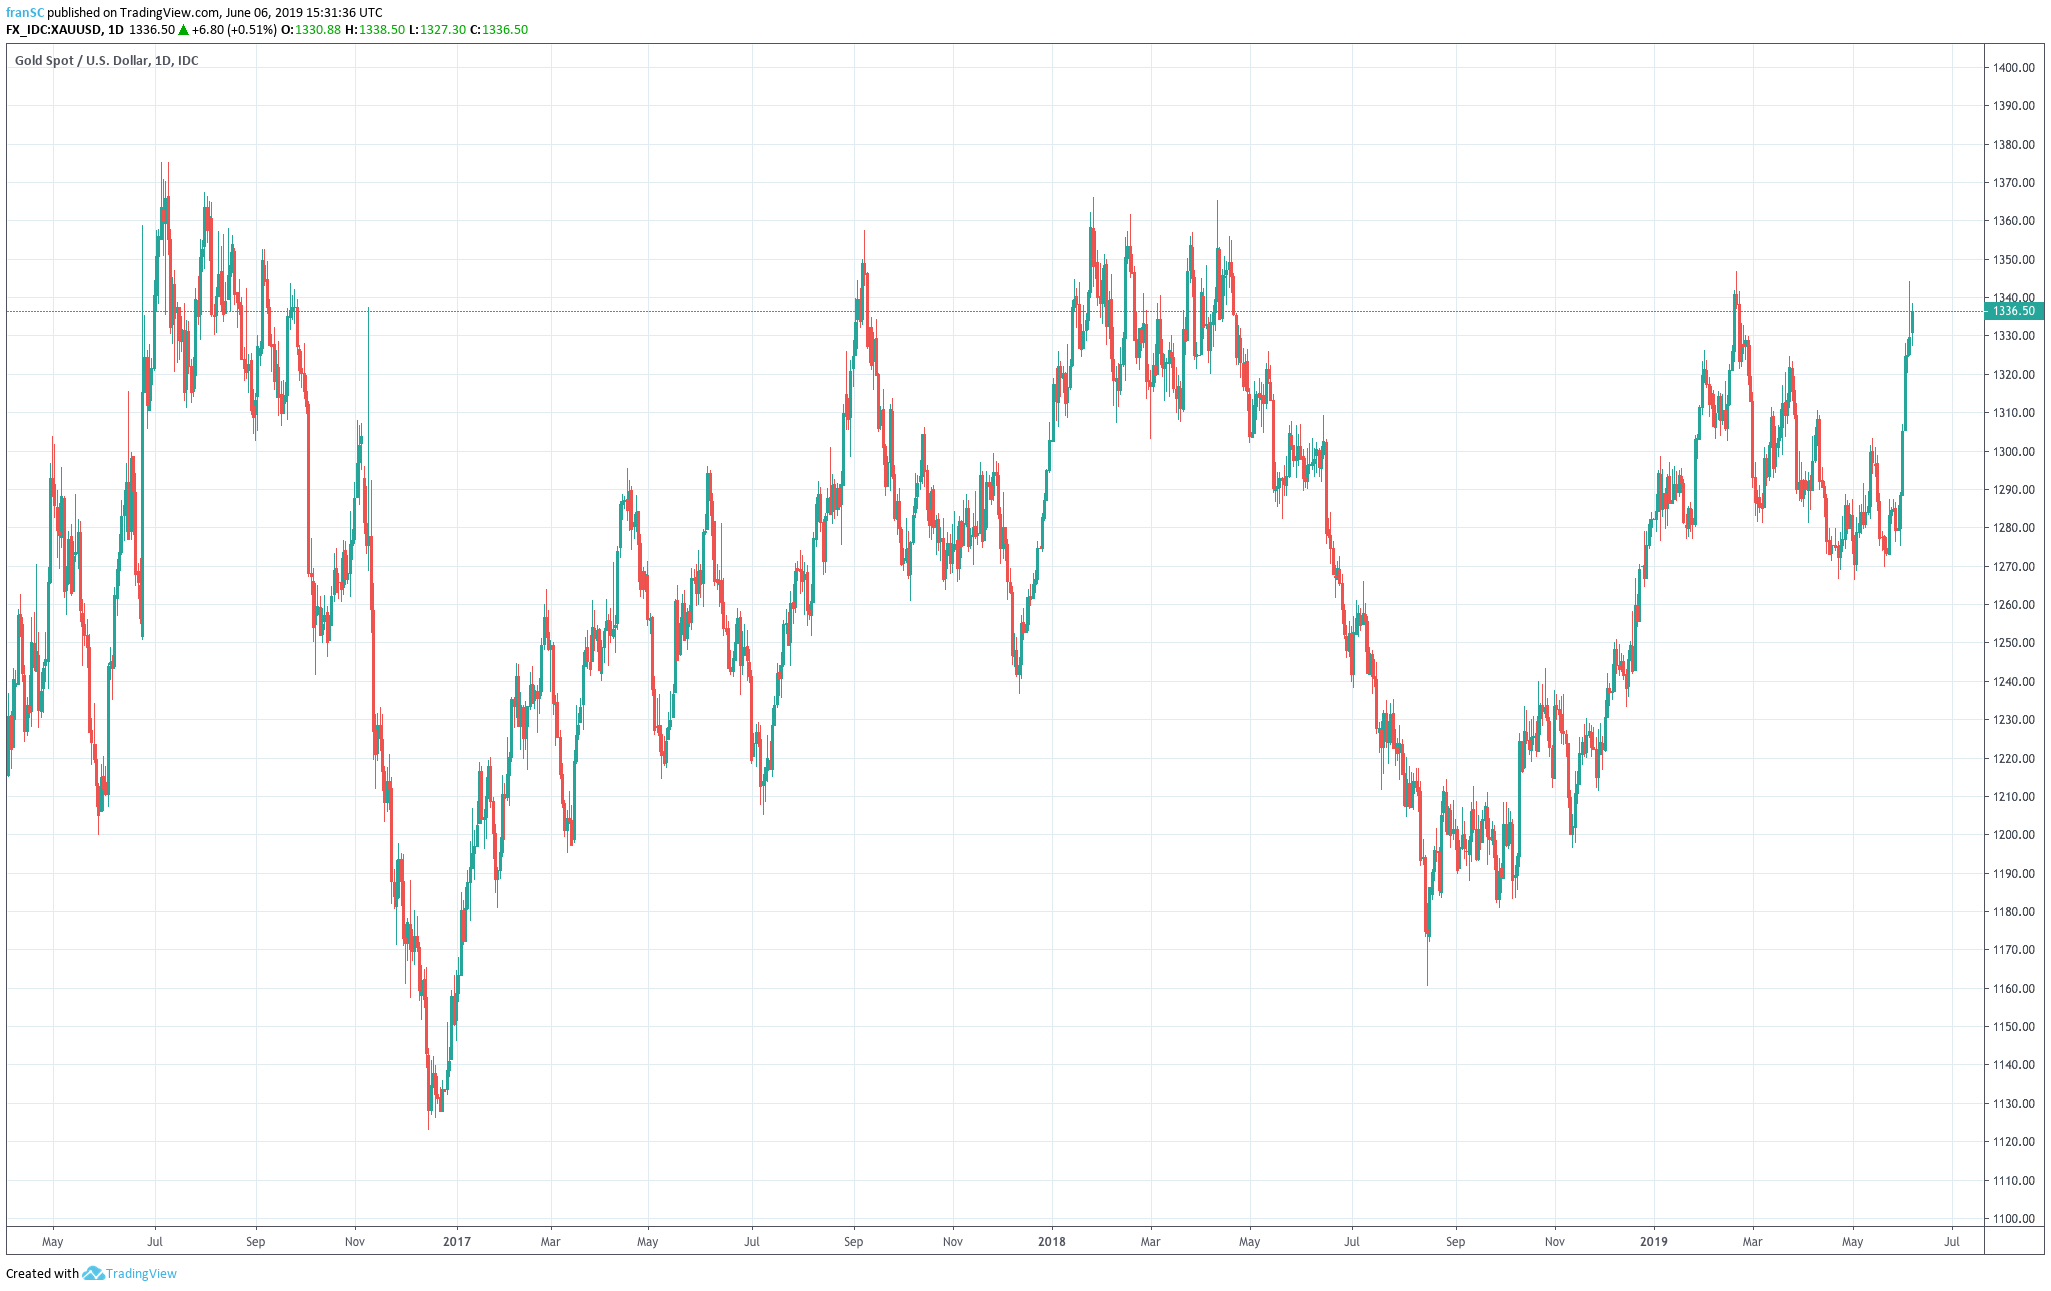
Chart 1- Multiple small Trends in the Gold Daily chart.
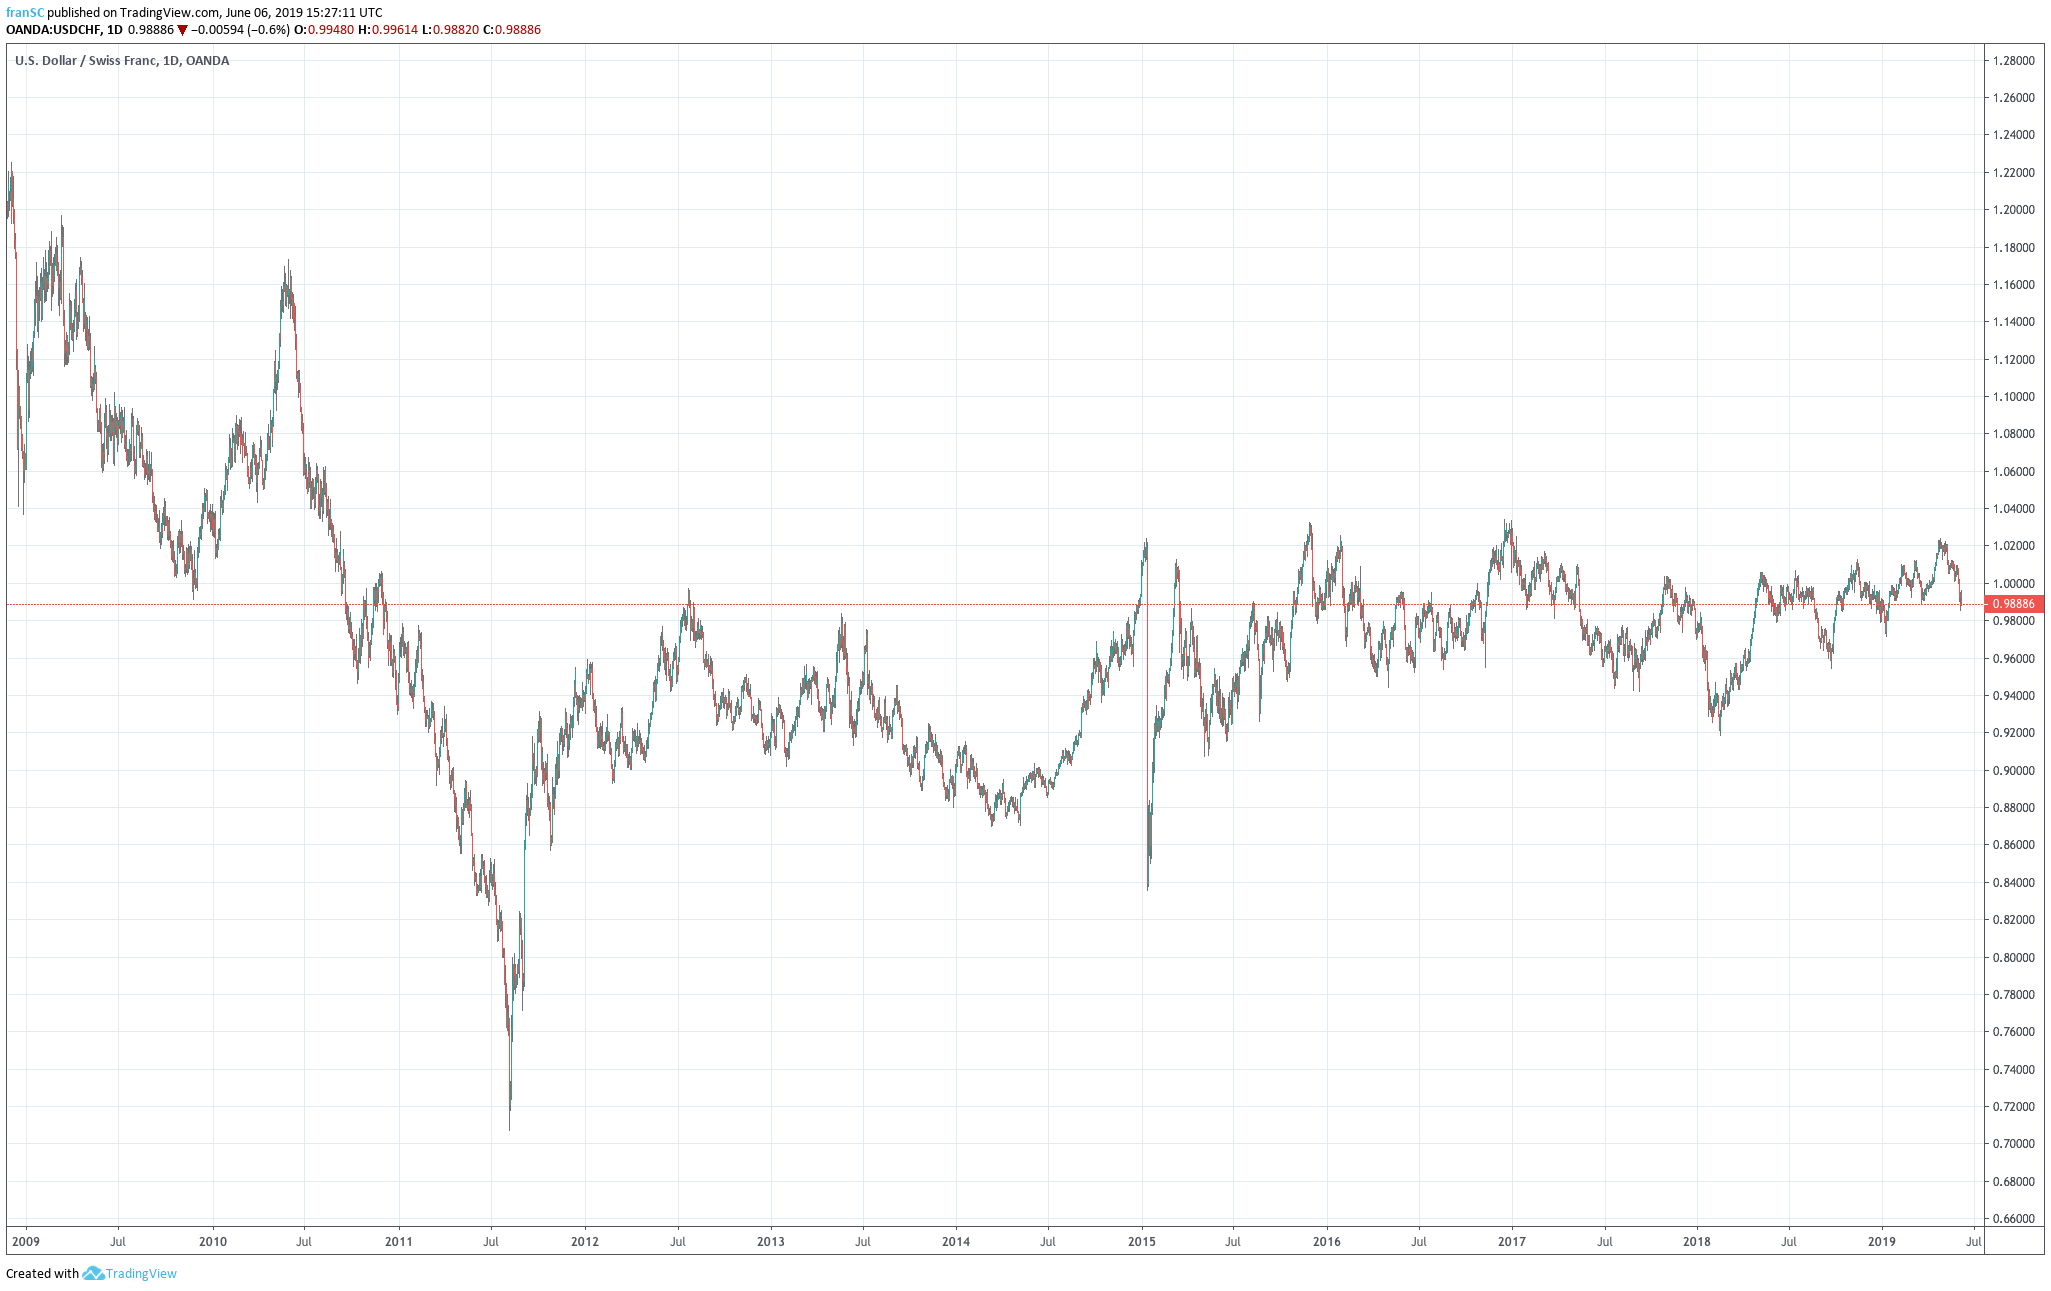 Chart 2- After 2012 the USDCHF has seldom created a usable trend in the daily chart
On chart 1 we see that the Gold (XAUUSD) daily chart has large swings, up and down. Every swing is a short-term trend that can be traded using charting techniques and price action.
On chart 2 we see the recent action of the USDCHF pair. After a long downward trend at the beginning of this chart and its reactive move up, the price is moving in a horizontal and noisy channel. Here the odds of profiting from trend-following techniques is almost none. The trader must move to shorter timeframes to detect trends. But, we must say that the shorter the time-frame the noisier the signal.
Correlation Between Assets
Let’s say we have a basket of open orders and all orders go against us. This condition signals the maximum risk the portfolio can get. That state is called 100% correlated. Every asset in the basket is moving in sync. Instead, if we have a well-chosen set in our trading portfolio we could see some of them lose money and others generating profits offsetting losses. Its total effect is that the equity curve is smoothed. We do not experience extreme gains but, also, no extreme losses. That is the reason to split the total risk into a set of uncorrelated bets.
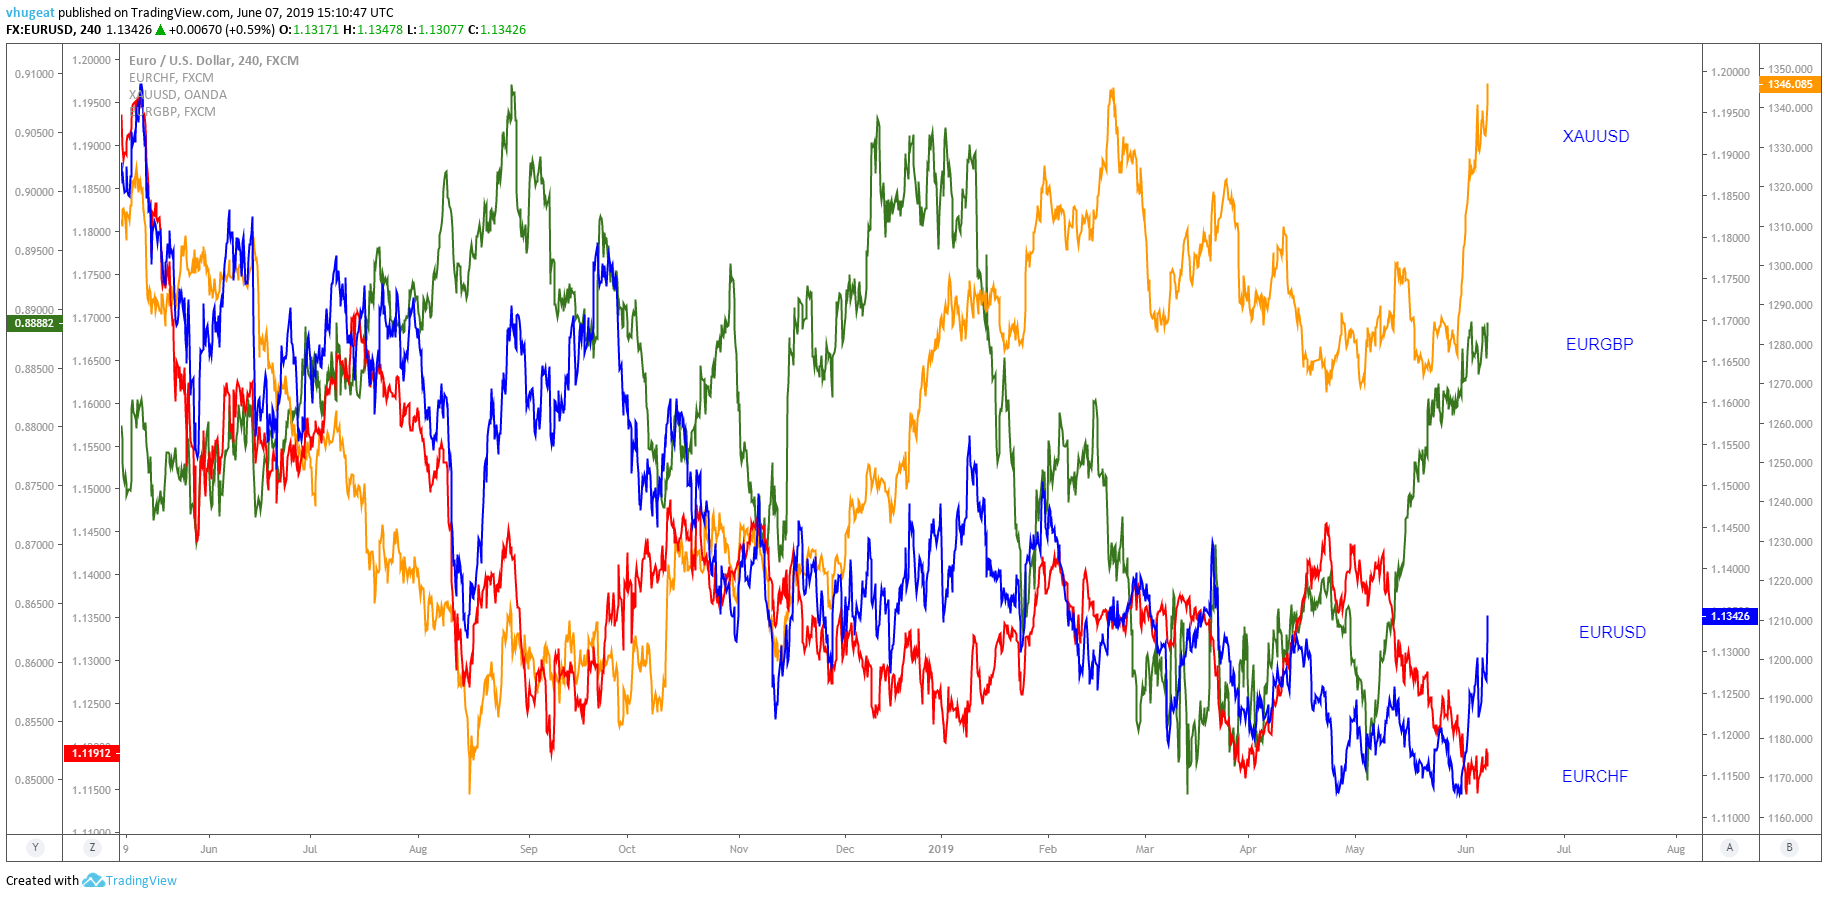
Chart 3 - Price action showing correlated and uncorrelated movements against each-other
On this page, you’ll find a nice correlation tool for you to use. The image below shows a correlation matrix of the major pairs and Gold (XAUUSD).
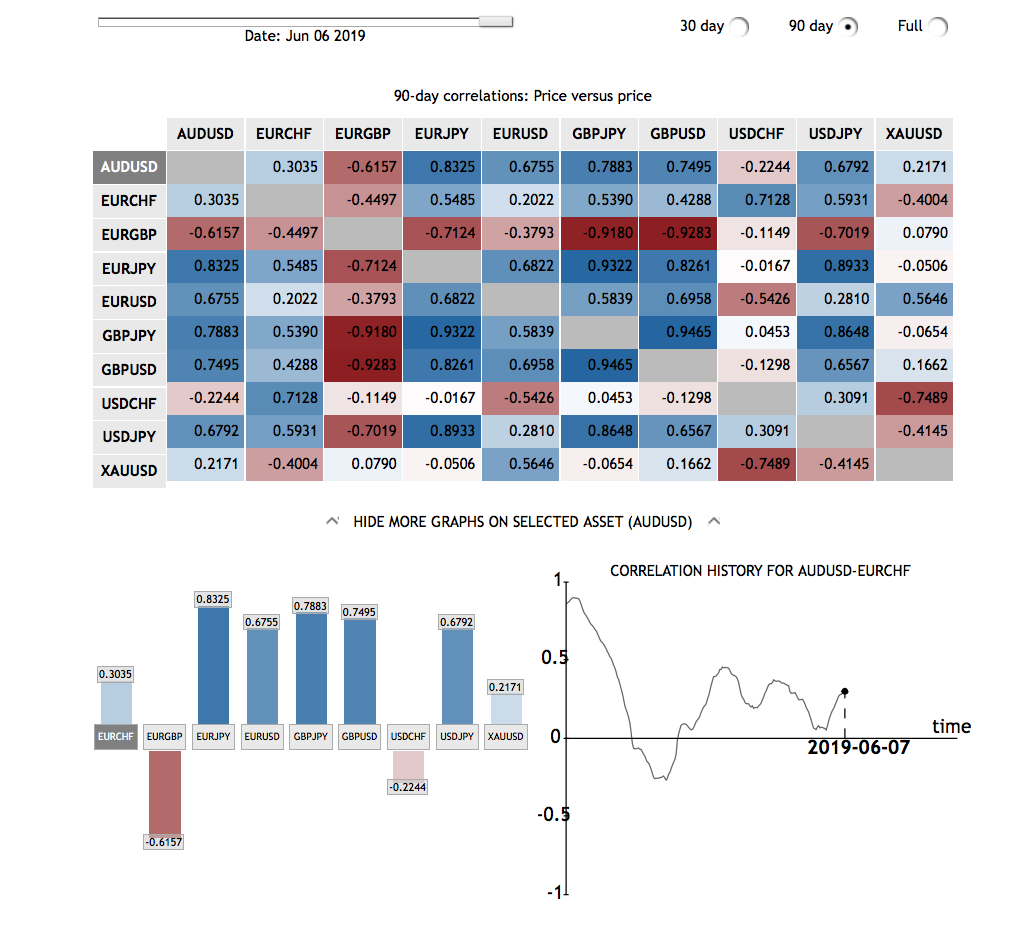 Image Credits: https://www.home.saxo/insights/tools/fx-correlations-table/tool-details
Based on your own preferences you could define four-assets for your basket with the shortest correlation number possible. The lower-right graph shows also that the correlation changes from time to time, therefore, do not consider your choice as immutable. From time to time you should check those correlations and make changes to keep your portfolio of tradable as neutral as you can.
One interesting idea is to hold negatively correlated assets to offset the positive correlation. For example, being long the Dollar against the Euro and short the Dollar against the Yen. In case there is a slump on the dollar against you it can be offset, at least partially, by your short position in the Dollar-Yen. Overall, the idea is to protect your portfolio against a large loss.
The next article will deal with time-frames.
