

Impulses and Pullbacks
Long-term Panoramic Classification
 The market is a constant movement that reflects the changes in the supply and demand for assets by millions of participants. Long-term participants agreed to classify the markets into Bull Markets and Bear markets. We could add Sideways Markets to it to complete all the possible actions the price can take: To move upwards, downwards or fluctuate in a horizontal band or range.
We saw in a previous article that Charles Dow went further and determined that Trends could be classified as Primary Tides, Secondary Swings and Daily Fluctuations.
R.N. Elliott refined this concept and called for a fractal market configuration composed by with Motive Waves and Corrective Wave., Motive Waves formed by five sub-waves, three motive and two corrective waves. Also, Corrective Waves were made of three components: two motive waves and one corrective wave.
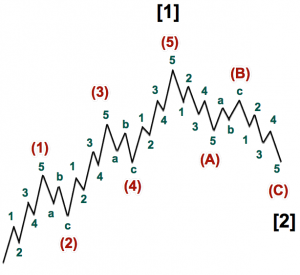
Elliott’s structure is fractal, because large waves, equivalent to what Dow called Primary Tides are formed by smaller waves we could regard as Secondary swings, these composed by even smaller waves and so on. The Elliott Wave Theory looks more complicated than what Charles Dow proposes, but in reality, is more straightforward.
That is so because Elliott has built the whole structure of the market movement with just two elementary formations: The Motive Wave and the Corrective Wave: Impulses and pullbacks.
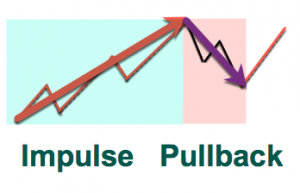
Thus, we can conclude that the market has two unique behaviours:
1.- It is developing a bullish or bearish trend
2.- It is correcting the latest trend.
Features of Impulses:
It looks evident that Impulses, what Elliott call Motive Waves are the vehicle for the price motion. We can see that on all timeframes, and, since every bar is a representation of the price action within a time lapse, we can clearly differentiate impulsive from corrective bars/candles.
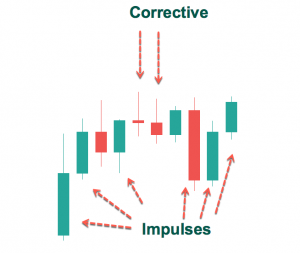
It is evident that large-bodied candlesticks are built by an impulsive wave of lesser degree, if you will. Sometimes the impulse is too lengthy to fit in one candle so we see a stream of candles, sometimes interrupted by a small-bodied candle that represents a minute corrective segment within the larger trend.
Therefore, we can deduce that:
Large bodies mean a trend inside that interval.
The trend belongs to impulsive segments.
A trend mean valuable information and less noise (thus, less volatitlty)
Features of Corrective Segments
Corrective segments are places of struggle. There, it is developing a fight for the control of the price direction. Therefore is noisy and directionless. We can see corrective segments as small-bodied candles in a proper time frame. If we zoom in we could observe a trading range in development, a channel contraction with triangular structure, or similar ranging patterns.
. Most of the time, this kind of market action cannot be traded
  profitably.
. Usually, the range is too thin to cover the costs and the risk
  to trade it.
. Corrective areas are to be watched to capture the breakout and
  be ready to enter the impulsive leg.
Impulses Pullbacks and Reward to Risk Ratio
For a trader, it is essential to be aware that the impulsive pattern, be it up or down, is where he could make profits with a consistent reward to risk ratio. Corrective segments are much harder to trade and show, also reduced rewards and higher risks due to their volatility and lack of direction.
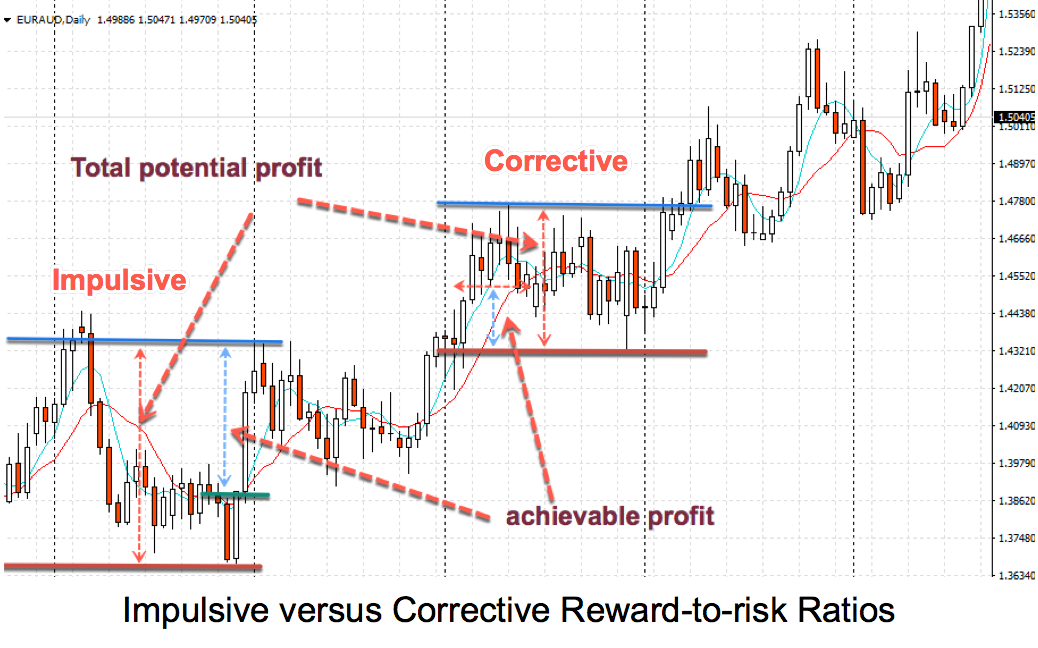
Chart 1 - Impulsive Versus Corrective Reward-to-risk Ratios.
The above daily chart of the EURUSD shows this. We can observe that the Reward to Risk ratio shown by an impulsive phase is much larger than of the corrective segment. On the impulsive wave, the potential reward more than double its risk; while trading the short side of a corrective phase presents an R/r below one, even in the ideal case of taking profits at the low of the band.
This is an excellent example of why we should never trade against the trend.
From this small discussion we can take the following bits of wisdom:
1.- Impulsive waves are where the real price motion occurs
2.- Impulses depict the least volatility and the best rewards for its
    risk
3.- Corrective waves are to be avoided or at least they should be traded
    differently
4.- Corrective waves shall be stalked to catch the breakout and profit
    from the next impulse.
