

BTCUSD had a ranging day yesterday. The daily chart shows that the Daily candle ended up as a Spinning Top with a very tiny bearish body. This indicates that the daily resistance has been a strong resistance level, which is getting even stronger. However, yesterday’s daily candle may as well be considered as a continuation of the bullish move if there is an upside daily breakout within a day or two. Otherwise, it may work as a bearish reversal daily candle if the price starts coming towards the South. This sums up the story that BTCUSD daily traders have to keep being patient to find the next direction of the price.
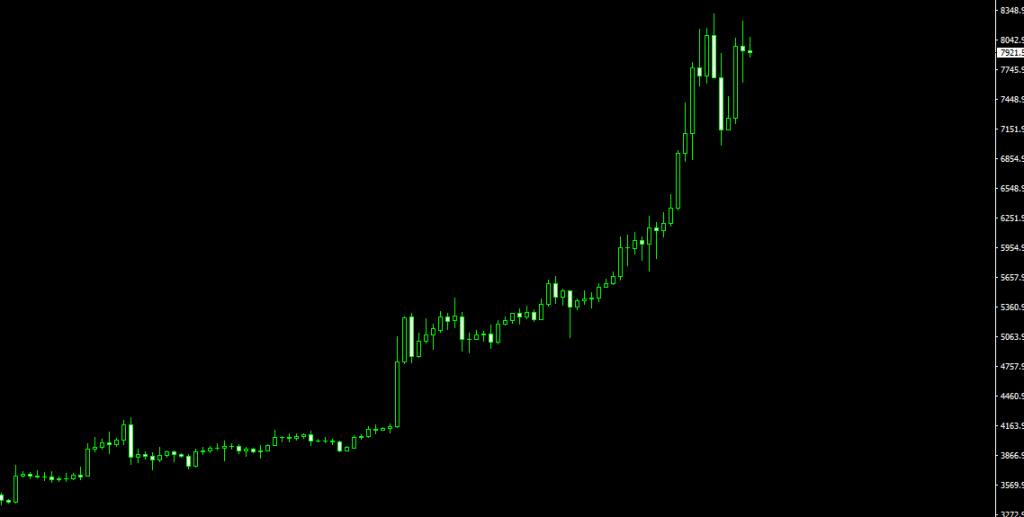
The Daily Chart
The daily chart shows that the last day’s candle has a tiny bearish body with long spikes at both ends. The price closed within the resistance level as well. This signifies the strength of the level of resistance. This might as well lead the daily chart to produce a double top and drive the price to go towards the South. On the other hand, there is a saying, the stronger the resistance/support, the stronger the breakout is. Thus, if an upside breakout does take place here that will be a strong breakout.
Let us have a look at the H4- BTCUSD chart and find out whether we get any clue for the next movement of the price.
The H4 Chart
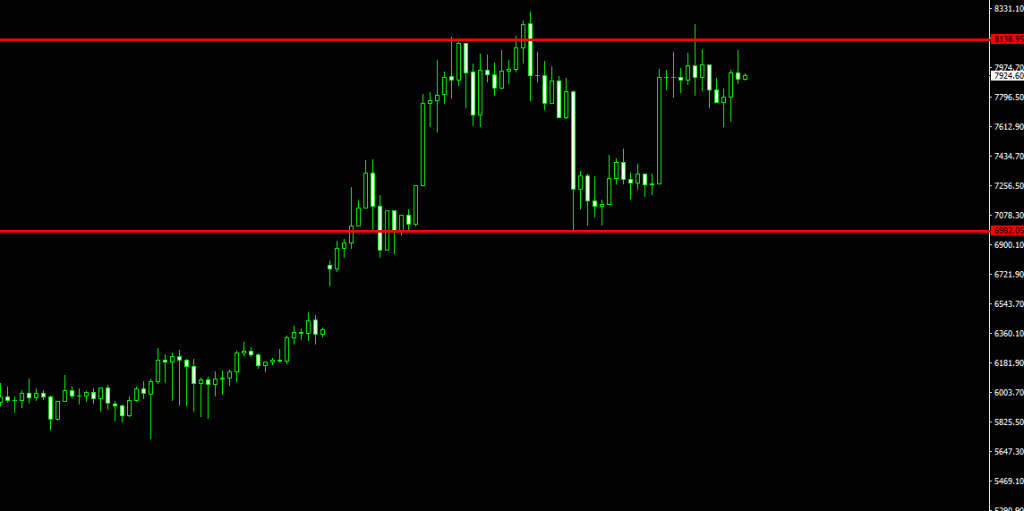
The H4 chart shows that two double tops are being formed so far. Those were not enough to drive the price towards the downside or make a breakout at the marked support level. At the moment, a pattern is being formed on the H4 chart; this is called ‘Cup and Handle’ pattern. The Cup and Handle pattern may attract the buyers to push the price towards the upside here. Let us wait and see what actually happens at the end. Meanwhile, BTCUSD daily traders must wait for the price to give them a solid clue which way it might head to.
