
BCHUSD produced a huge bearish daily candle yesterday. There was a resistance nearby, and the buyers were waiting for an upside breakout on a bearish inside bar daily candle. That did not happen. The way the daily candle looks, it may make the sellers confident again to sell off BCHUSD. However, the equation is not as simple as it looks with the naked eyes. The price did hold at a support level of an equidistant channel. This really makes the whole scenario very interesting. Let us have a look at the BCHUSD-Daily chart.

The Daily Chart
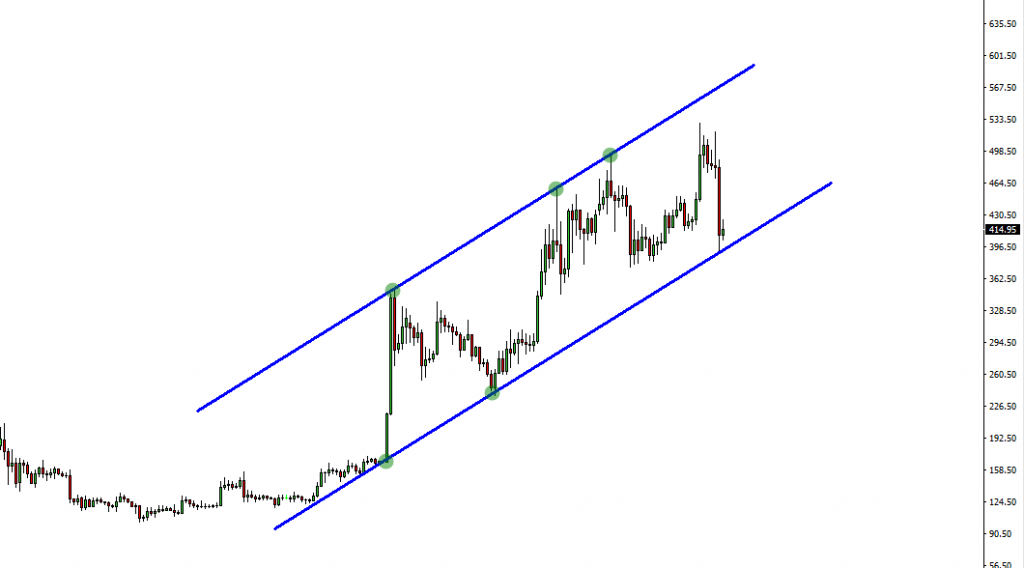
The daily chart has been obeying the ascending equidistant channel. The price had a bounce twice at the support and had rejection three times at its resistance level. Even yesterday’s strong bearish momentum was held by the support level as well. A daily Doji candle followed by a daily engulfing candle right from the support level may attract the buyers again to go long on BCHUSD.
The H4 chart’s price action suggests that the price might come out from the equidistant channel if it makes a downside breakout. Let us have a look at the H4-BCHUSD chart.
The H4 Chart
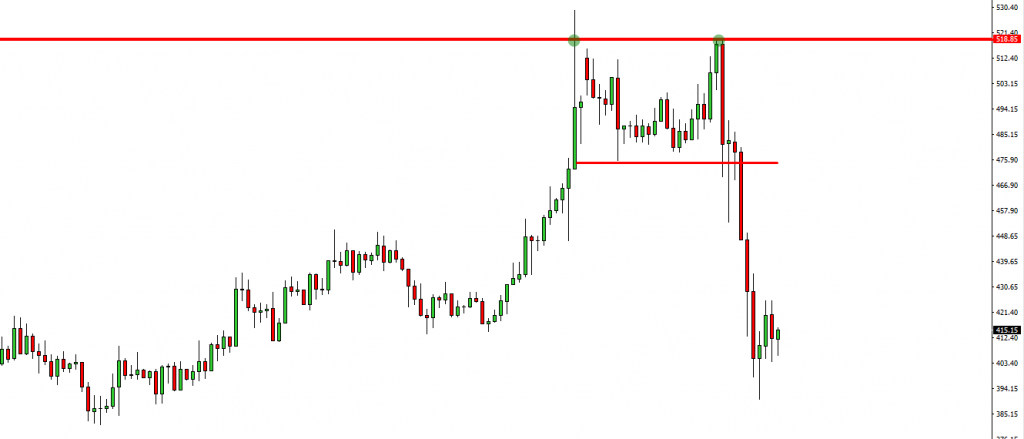
Have a look at the chart. It shows that it has produced a double top right at the resistance level. The neckline was breached, and the price has been heading towards the South with huge momentum. The price has been having a consolidation at the moment. If it makes a breakout at the lowest low of the wave, then surely it would be a signal for the sellers to go short on BCHUSD.
The Bottom Line
As we see that the price is at a very critical position as far as the daily and H4 chart are concerned. The daily chart suggests that the daily traders must wait for a bullish reversal candle to be produced. On the other hand, the H4 chart suggests that the traders wait for a downside breakout to go short. Let us wait and see who wins the battle.
