
Introduction
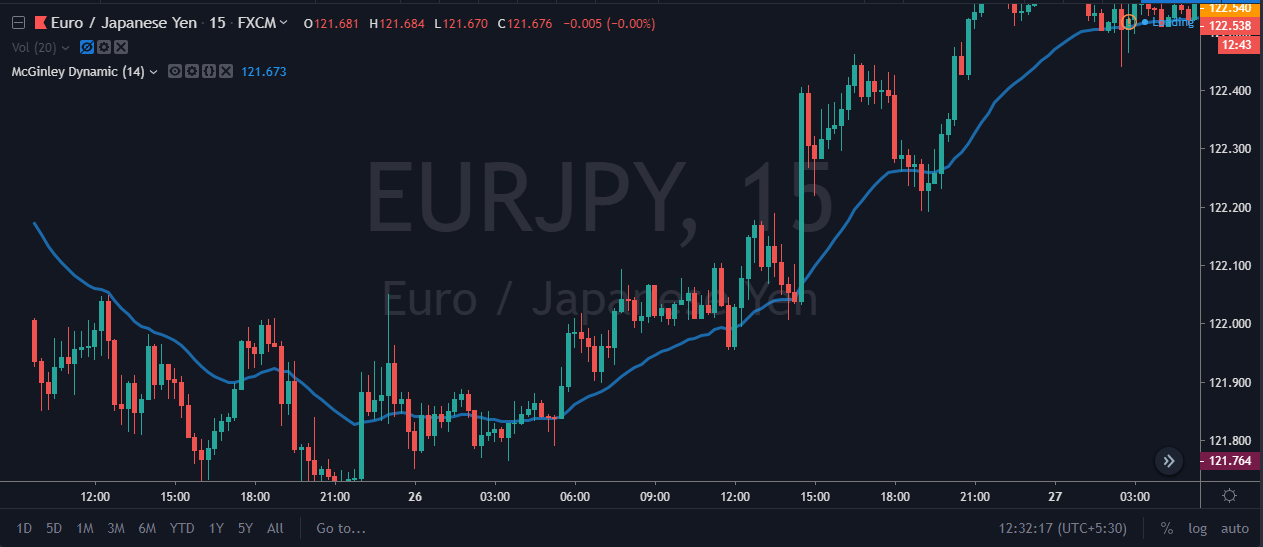
McGinley Dynamic is a technical indicator developed by a market technician, R. McGinley in 1997. This indicator improves upon simple moving average lines by adjusting itself for shifts in the market speed. This is because; the market does not move at a consistent pace all the time. That is, it speeds up and slows down inconsistently.

During the research of moving averages, McGinley found many problems in this indicator. He observed that the moving average often lags, thus, providing late signals. Whereas, the McGinley Dynamic Indicator, on the other hand, changes according to the momentum of the market. This indicator minimises price separations and volatile whipsaws, so that price action is more accurately reflected in the line. The conventional moving average has a fixed period (10, 20, 30), which results in a fixed speed.
Irrespective of the speed of the market, this indicator significantly avoids the whipsaws. However, people don’t understand when to use the 10-period MA or the 20-period MA in the market. So, to solve the problem of choosing the length, the McGinley indicator automatically adjusts itself according to the speed of the market.
The McGinley Dynamic Indicator is of two types:
- MD PERIOD - Here, the period for the McGinley indicator must be 60% of the moving average’s period. So, if your MA period is 30, then set the period to 22 for the McGinley Indicator.
- MD Smoothing - It adjusts the sensitivity of the line; whose default value is 125.
Installing McGinley Dynamic Indicator In MT4 (Step-by-step procedure)
By default, the McGinley Dynamic indicator is not available in the MT4 Terminal, but it can be found on the internet.
Follow the link below to download this indicator.
https://www.best-metatrader-indicators.com/mcginley-dynamic-indicator/
Download the zip file from the link, extract it and then paste it to your MT4 directory/MQL4.
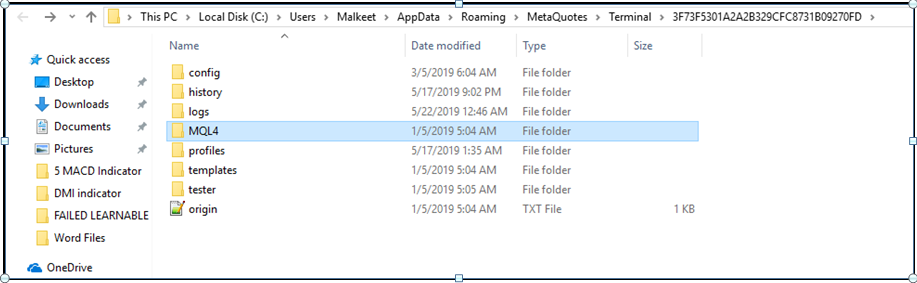
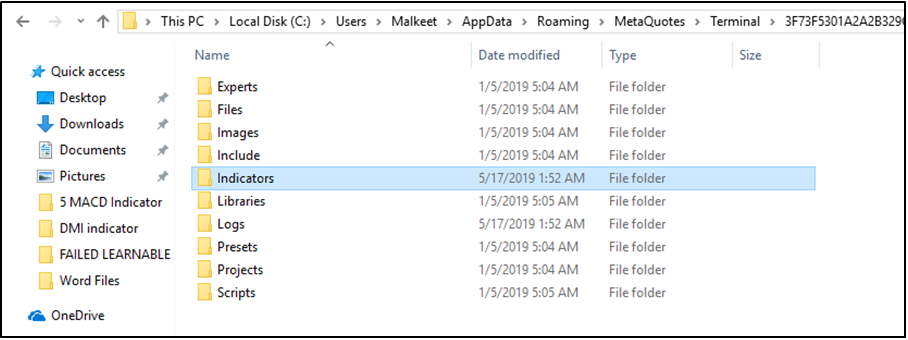
Click on indicators and paste it in the location, as shown below.
Restart your MT4 Terminal.
Click on the Insert > Indicator > Custom > McGinley Dynamic Indicator.
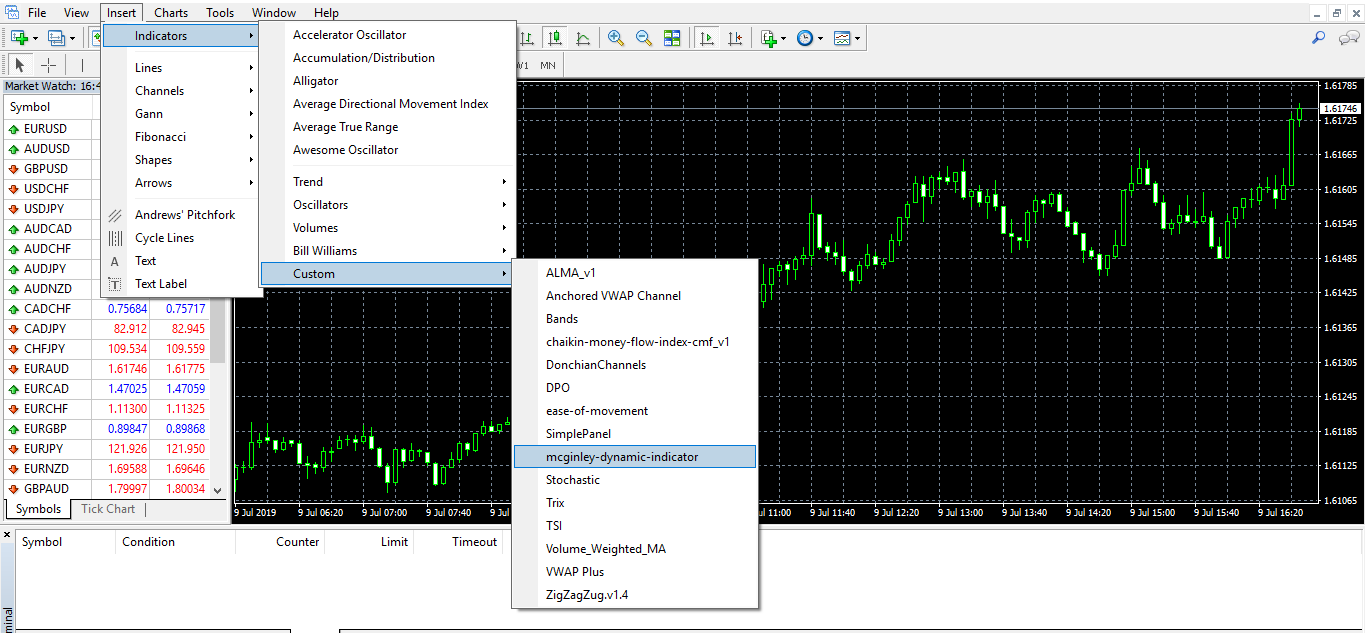
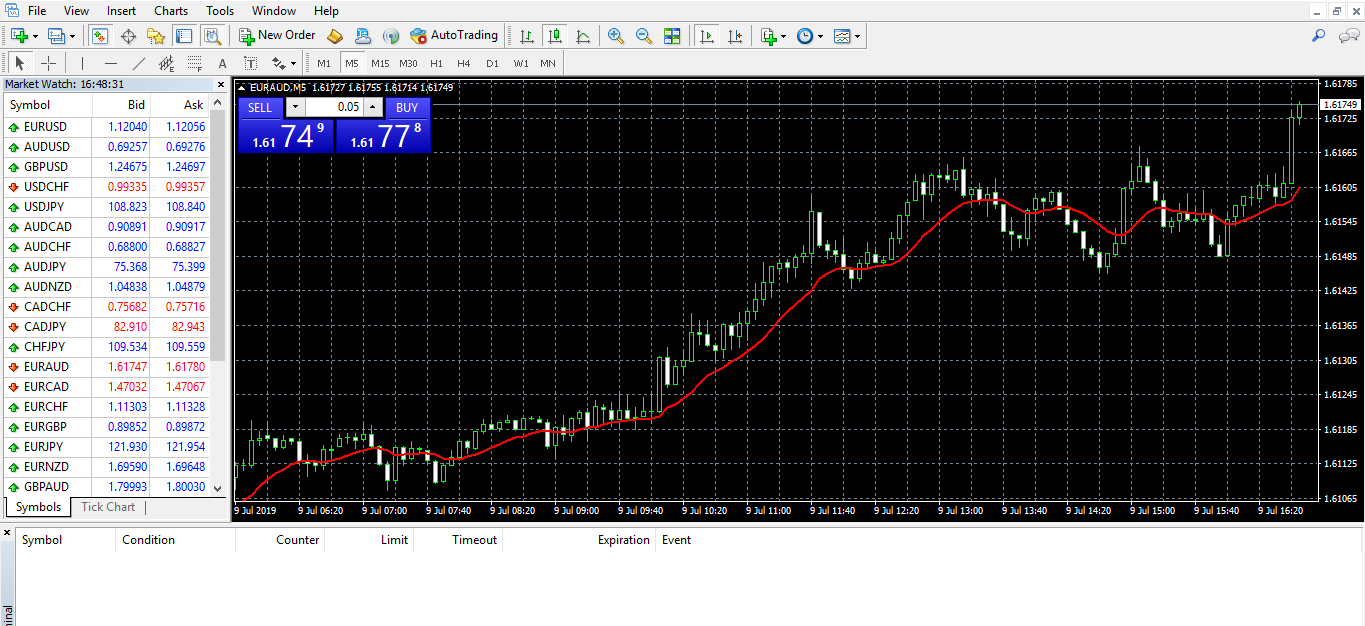
You can see in the image below we apply the indicator on the EURAUD chart.
McGinley Dynamic Indicator - Trading Strategies
McGinley Dynamic Indicator + Know Sure Thing Indicator
The problem with novice traders is that they take a single indicator and start trading with it without any other technical tool. As a result, they lose money in no time. Well, it’s not easy to generate money solely from one indicator. Therefore, it is suggested to pair an indicator with other indicators or some analytical tools to generate trading signals. Also, when you create a new trading system always backtest it on a simulator first because some of the indicators work best in ranges, some of them works in trends.
In this strategy, we paired the McGinley Dynamic Indicator with the Know Sure Thing Indicator to identify trading signals.
The Know Sure thing is a momentum indicator. It shows the difference between the closing price of the current day and the closing price of the previous two days. This indicator can be used in the same manner as other momentum indicators, such as RSI and Stochastic. When the indicator goes above the signal line, it means the trend is bullish; and when it drops below the signal line, it indicates a bearish market.
Buy Example
According to this strategy, when the McGinley dynamic indicator goes below the price action, and the KST indicator moves above the zero-line; it indicates a buy signal.
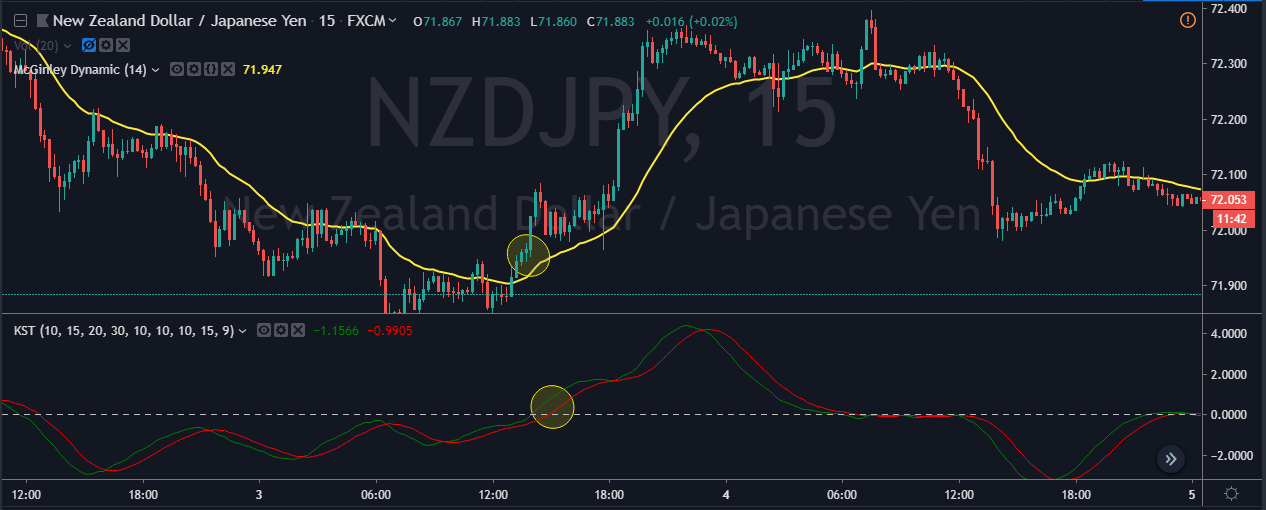
In the above chart of NZDJPY, we can see that the market was in a pullback phase initially. Firstly, the McGinley indicator shifts below the price action, followed by the KST indicator, which goes above the zero-line. This is a sign that the sellers are done with their pullback phase. So, now we can expect a reversal in this pair.
Moving forward, when both of the indicators generated the trading signal, the price immediately went north. As far as the take profit is concerned, when the KST indicator goes way above the zero-line and gives the crossover, one can close the trade.
Sell Example
When McGinley Dynamic Indicator goes above the price action, and the KST indicator goes below the zero-line, it indicates the selling trade.
Below is the chart of NZDJPY on the 15min timeframe. We can see that the market is in a strong downtrend. When the KST indicator goes below the zero-line, and the McGinley Dynamic Indicator also goes below the price action, it indicates a sell. During a strong trend, the market often makes brand new lower lows. However, we suggest you follow the rules, by closing the position when KST indicator gives you the crossover below the zero-line.
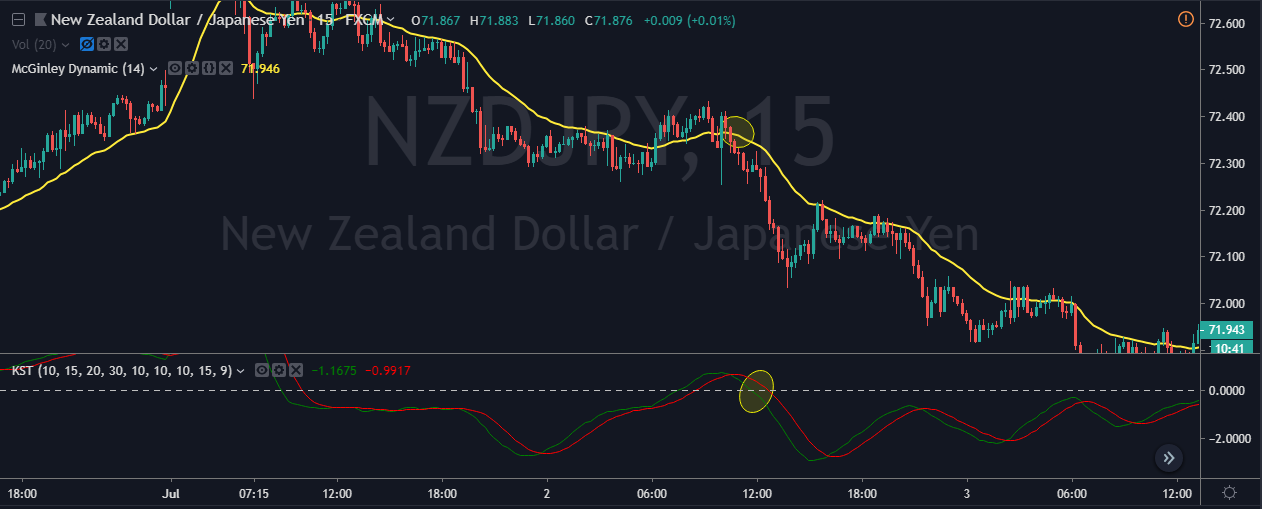
Traders, who always follow the rules, make more money than the one who tries to make a million dollars in just one trade. Trading is an everyday process and not a get-rich-quick scheme. So, always make sure to follow the rules of your trading system.
McGinley Dynamic Indicator + Demarker Indicator
In this strategy, we paired the McGinley Dynamic Indicator with the Demarker indicator to identify the trading signals.
The Demarker Indicator was initially devised with daily price bars in mind, but it applies to any time frame because it based on the relevant price data. This indicator quickly tells you the price change in the market.
Traders use this indicator to find out the overbought and oversold conditions and to enter or exit a trade. When the indicator is below 30, it means the market is oversold indicating a bullish reversal; and when the indicator goes above the 70, it indicates a bearish price reversal.
Buy Example
According to this strategy, when a smaller period McGinley dynamic Indicator cuts the more extended period from below the price action, and the Demarker indicator gives a reversal at the oversold area, it signifies a buy signal.
In the below USDJPY 15-minute forex chart, the market was in an uptrend. During the pullback phase, the 14 period McGinley indicator cuts the 35 periods, and the Demarker indicator also gives sharp reversal at an oversold area, indicating a buy signal.
When the Demarker indicator reaches the overbought area, it is a sign to close the trade. And, the stop-loss can be kept just below the most recent candle. In this way, one can easily make 3-4R in every trade.
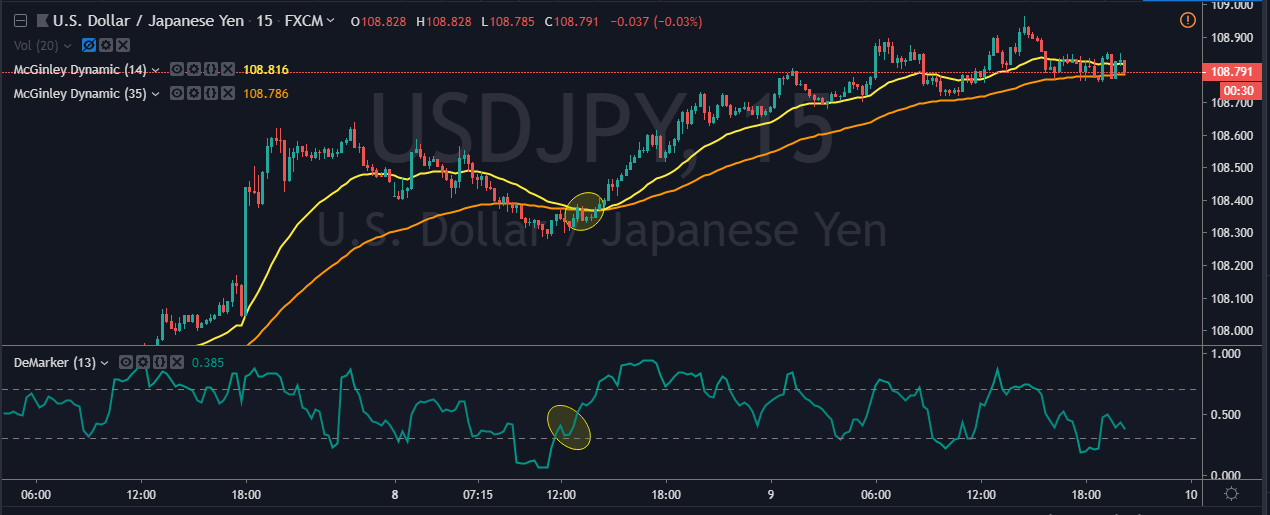
Also, note that this strategy generates fewer trades because it works well only in a trending market. However, the signals generated are always accurate.
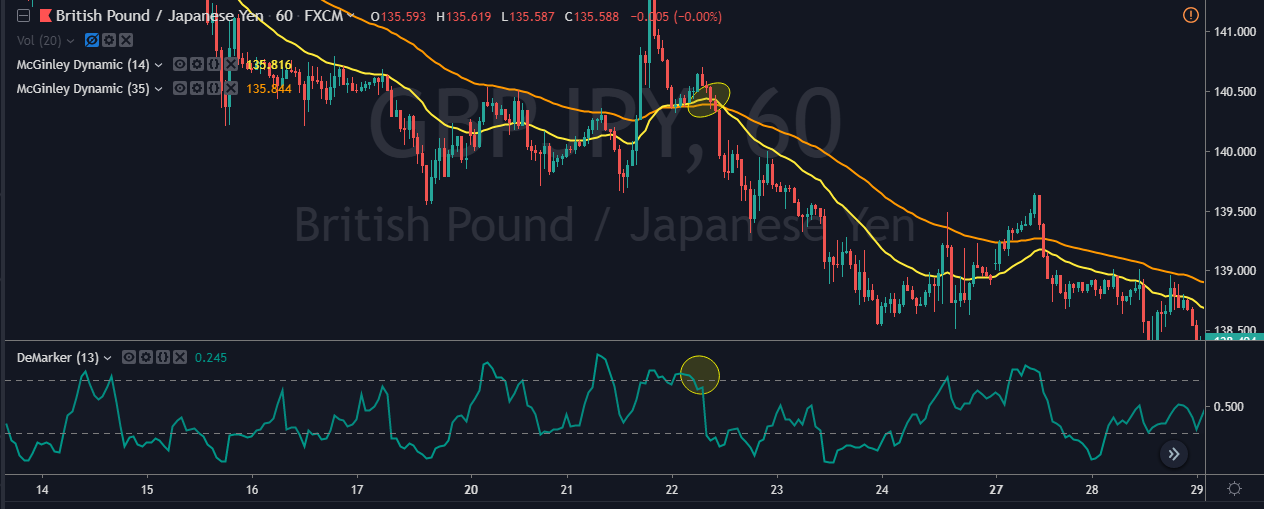
Sell Example
In this strategy, when the McGinley gives a crossover above the price action, and Demarker indicator provides a sharp reversal at the overbought area, it indicates bearishness in the market.
Initially, the overall trend was down in the below GBPJPY chart. When the crossover happened on the McGinley indicator, and the Demarker gave a reversal at the overbought area, it is a sign of trend reversal.
If traders use only one indicator for their analysis, then most of the time the indicator identifies many signals, where most of them are fake. This is the reason we always pair an indicator with another indicator to filter out the inaccurate signals.
Moreover, when one indicator aligns with another indicator, it is called an eclipse (moon aligning with the sun). So, when an eclipse occurs in the market, one can expect significantly large moves.
Bottom line
McGinley Dynamic Indicator is a fascinating tool developed by a market technician who studied the indicators and markets for around 40 years.
McGinley dynamic indicator is a new version of the Moving Averages because it is a leading indicator and always tracks the price action very closely by changing itself according to the market circumstances.
This indicator increases its speed in a downtrend and slows down in an uptrend. Make sure to combine this indicator with other technical tools for double confirmation. Happy Trading.
