
Introduction
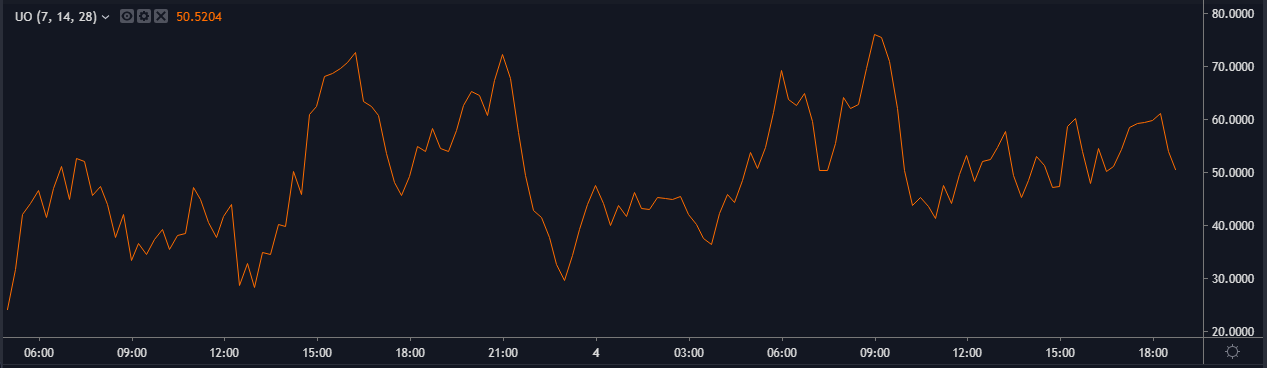
Larry Williams developed the Ultimate Oscillator in 1976. It is typically used to measure the momentum of the price of the currency across multiple timeframes. This Indicator was also featured in Stocks & Commodities Magazine in 1985. The Ultimate Oscillator is a range bound indicator with values that fluctuates between the 0 and 100 levels. The levels below 30 are considered as the oversold conditions while the levels above 70 are considered as the overbought conditions in the market. Most of the momentum indicators are generally focused on the near term price movement. The oscillator’s values incorporate multiple timeframes to smooth out the movement and avoid false divergences since the buy and sell signals are generated in the market following a divergence. Its multi-timeframe calculations make it develop fewer, but more accurate, divergence signals.
The indicator rises when the buying pressure is strong, and it falls when the buying pressure is weak.
Calculation
Ultimate Oscillator = 100 x [(4 x Average7) + (2 x Average14) + Average28] / (4 + 2 + 1)
Buying Pressure (BP) = Current Close – Minimum (Current Low or Previous Close).
True Range (TR) = Maximum (Current High or Previous Close) – Minimum (Current Low or Previous Close)
Average7 = Sum of BP for the past 7 days / Sum of TR for the past 7 days
Average14 = Sum of BP for the past 14 days / Sum of TR for the past 14 days
Average28 = Sum of BP for the past 28 days / Sum of TR for the past 28 days
Installing ‘Ultimate Oscillator’ in MT4 (Step-by-step procedure)
By default, the Ultimate Oscillator is not available in the MT4 terminal. However, you can download it from the corresponding link. Ultimate Oscillator.
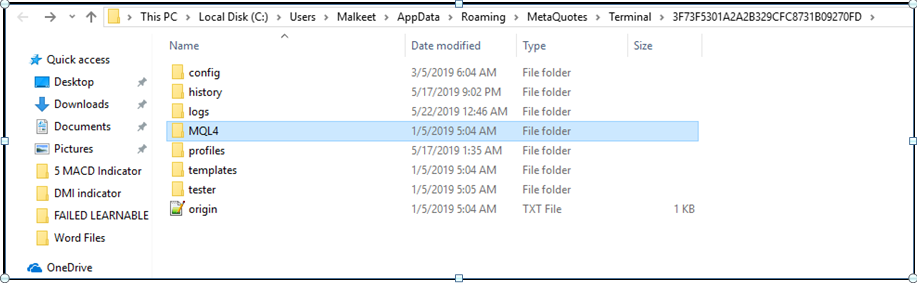
Copy the Ultimate Oscillator to your MT4 directory/MQL4
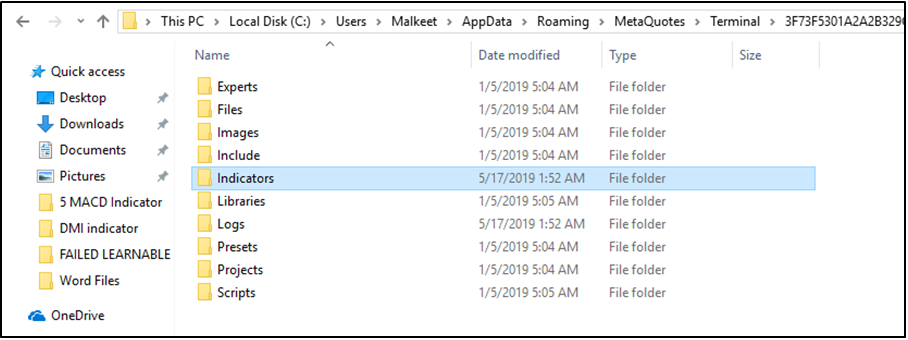
Click on indicators and paste here.
 Restart your MT4 terminal.
Click on the Insert > Indicator > Custom > Ultimate Oscillator.
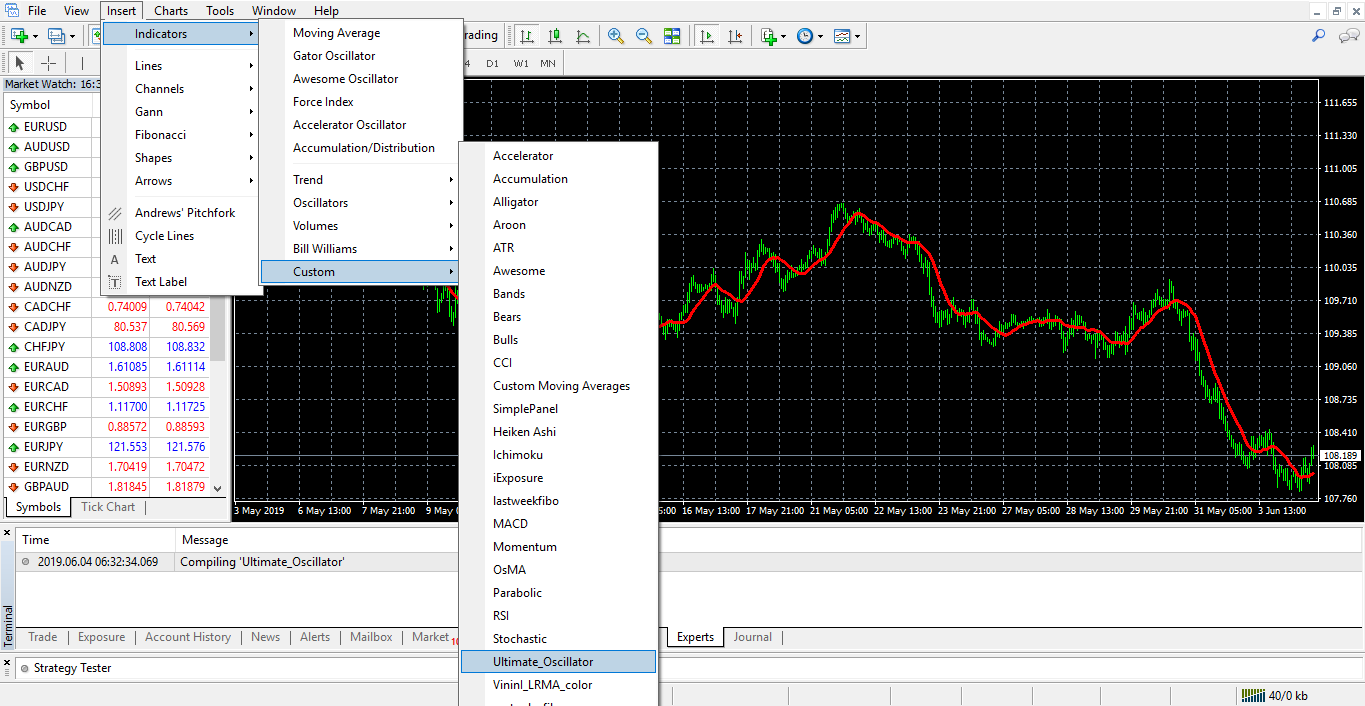
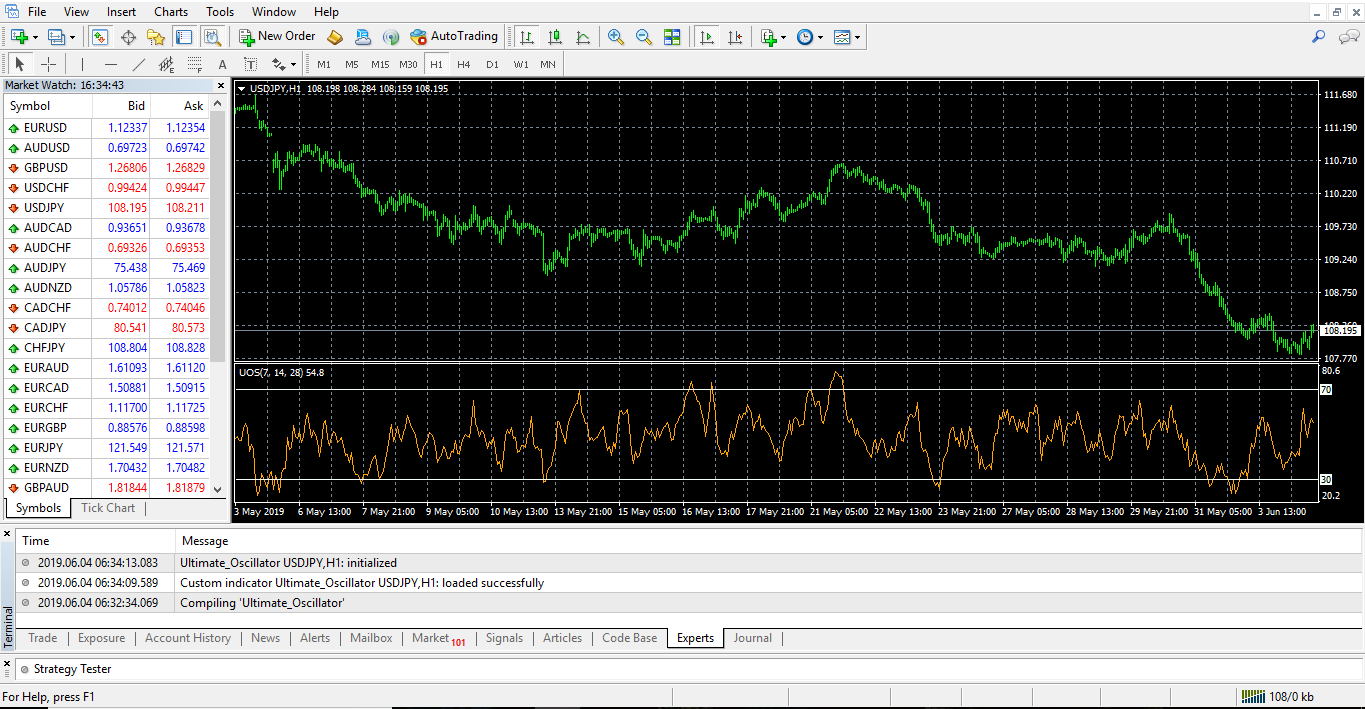
In the image below, we have applied the Ultimate Oscillator to the USD/JPY chart.
Ultimate Oscillator Trading Strategies
For this indicator to generate a buy or sell signal, Williams recommended a three-step approach.
For Buy Signal
1. Wait for the bullish divergence in the market. This means, the price should make a lower low, but the indicator should display a higher low.
2. The first low in the divergence must have to be below the 30 levels on the indicator. It means that the divergence should start from the oversold territory, and more likely to expect an upside reversal.
3. The indicator must rise above the divergence high. Divergence high is nothing but a high point between the two lows of the divergence.
Buy Example
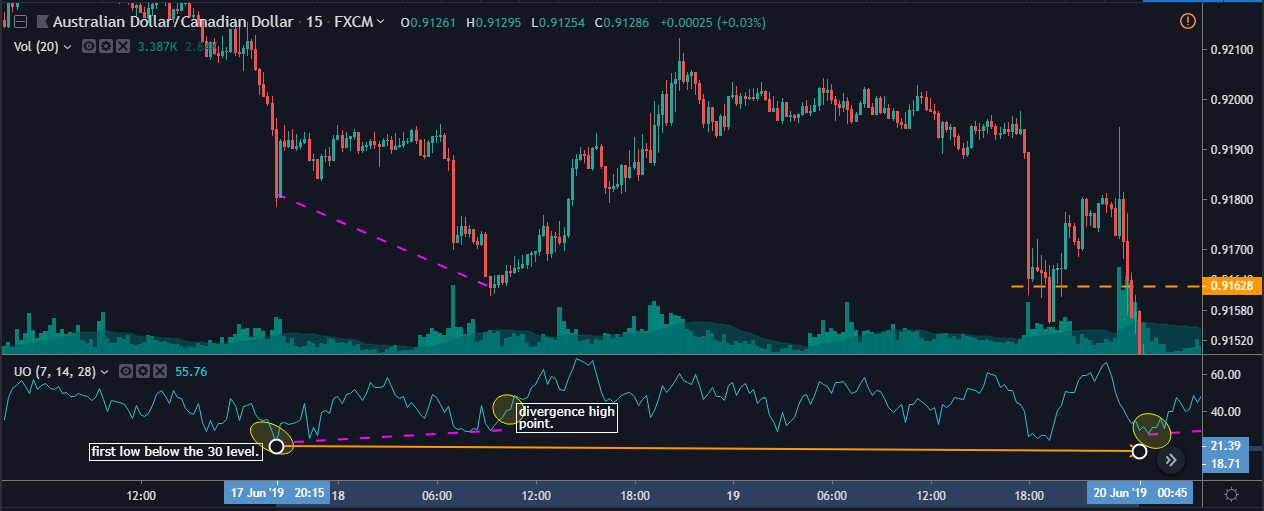
In the AUD/CAD chart above, the trend was to the downside and has printed a lower low. But the indicator stopped drawing lower lows. Instead, it started showing a higher high. This is a clear bullish divergence. Look at the first circle on the indicator: It was below the 30-level. You can see an arrow pointed out at 21.39 at the right corner on the chart. It means the indicator is below the 30-level. Now, look at the second circle on the chart. This point is where the indicator is above two lows of the divergence, giving us a clear ‘buy’ signal. Always remember to place your stop-loss below the recent low in the market and book profit at the most recent resistance area.
For Sell Signal
1. Wait for the bearish divergence in the market. This means the price should make a higher high, but the indicator should display a lower high.
2. The first high in the divergence must have to be above the 70-level on the indicator. It means that the divergence should start from the overbought territory, and more likely to expect a downside reversal.
3. The indicator must drop below the divergence low. Divergence low is nothing but a low point between the two highs of the divergence.
Sell Example
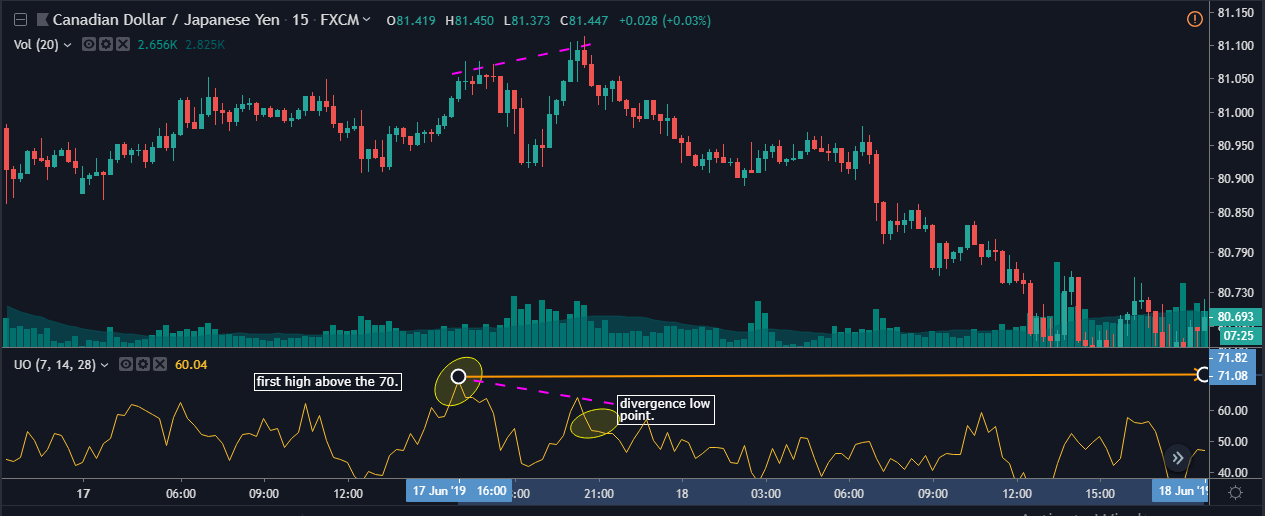
In the below CAD/JPY Forex chart, we can see the bearish divergence where the price was making a higher high, but the indicator is displaying a lower low. Then the first circle on the indicator shows that the indicator was above 70, which means the reversal started from the overbought area, and the downside reversal is most likely to occur. The second circle shows that the indicator is dropped below the divergence low, which gives us a potential sell signal.
Ultimate Oscillator and RSI Divergence
In this strategy, we paired the RSI with the Ultimate Oscillator to generate trading signals. RSI stands for Relative Strength Index, and it oscillates between 0 - 100 levels. The Ultimate Oscillator is not a popular indicator, but the RSI is famous among the traders for a long time now. As you know by now, the Ultimate Oscillator gives us the divergence signal to trade, and the RSI indicator also shows the divergence in the market. Divergence essentially means the indicator is not satisfied with the price move, and soon, a reversal is expected. In this strategy, we look for the divergence on both the indicators to generate trading signals. The critical point to remember is to always trade with the trend. If the market is in a downtrend, then only look for the bearish divergence. Likewise, if the market is in an uptrend, look for the bullish divergence on both the indicators.
Sell Example
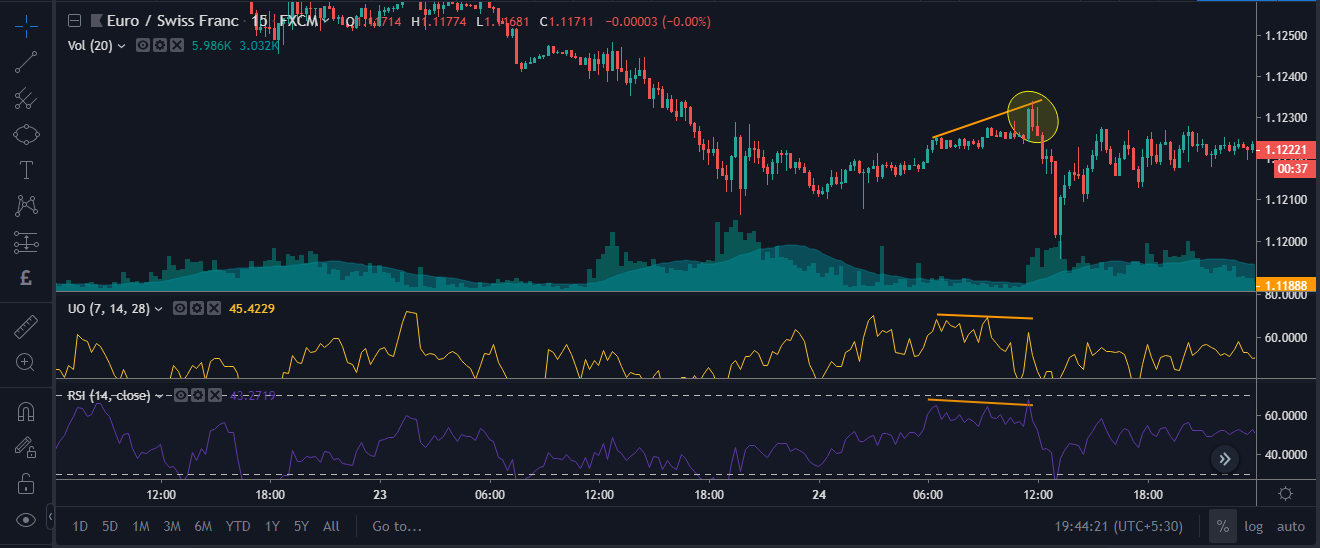
In the above Euro/Swiss forex chart, the market was in a downtrend and during the pullback phase both the indicators are having a hard time to go higher, but the price was printing a lower high. This is a potential sign of a trend reversal in the market. If you had taken this trade, you would have made 20 pips in just an hour. We suggest you place the stop-loss above the recent high and close the trade when the RSI indicator reaches the overbought area.
Buy Example
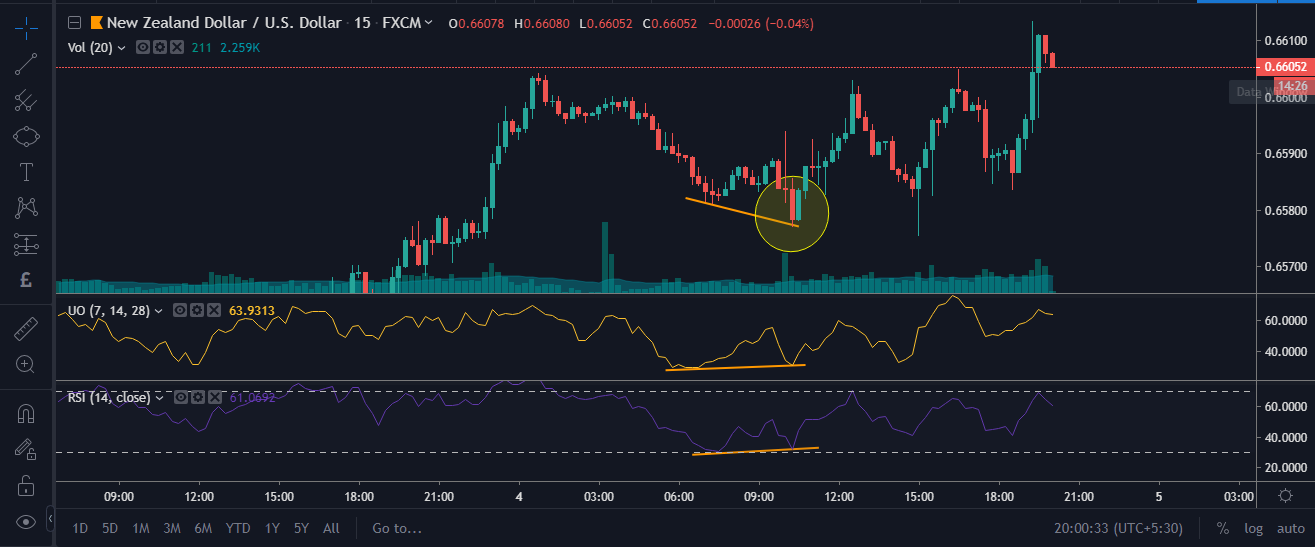
In the above NZD/USD chart, the price was in an uptrend and printing the higher low. Whereas, both the indicators are displaying a bullish divergence. That’s a potential ‘buy’ signal. Look at the chart how smoothly our signal has worked.
Bottom Line
The Ultimate Oscillator is a momentum indicator, and it provides trading signals by showing us the bullish and bearish divergence. This indicator works best on all the existing timeframes. The levels below 30 can be considered as an oversold condition, and the levels above 70 can be considered as an overbought condition. Divergence is a standard strategy, but we suggest you do not depend on one indicator’s divergence. Confirm that divergence with other divergence indicators as we did just now for more accurate signals.