
Getting Started
There are several ways of trading in the market, with Price Action being one of the most popular trading styles. Unfortunately, not all so-called Price Action traders are trading the way they should. Price Action traders think that Price Action trading means trading without the indicators. Well, this is partially correct. But, they still do not have an edge. Hence, to have the edge over the average traders, it is essential to understand what trading actually is.
The most common answer to this would be, trading is buying and selling. Having this simple understanding is insufficient to trade. Understanding how to make money from buying and selling is the real deal. If everyone is buying no one’s selling, it is impossible to make money as the other party (sellers) does not exist. So, let’s understand the real essence of Price Action.
Well, in Price Action trading, it is least important to have a chart. Just a comprehension of how the price is moving is sufficient to trade in the markets. Consider the given example.
Consider an imaginary stock which we wish to trade. And lets the price of the stock is $1.66. The market opens at 08:00 AM and the stock’s price is $1.66. For now, forget the charts and focus only on the movement of the price. At 08:15 the price becomes $1.68, at 08:16 the price is $1.66, at 08:20 it’s $1.69. At the moment, what is happening in the market? There is actually nothing much happening in the market. The price is just hovering around the open price. There is a negotiation taking place. Moving forward, at 08:30 the price is $1.88, at 08:40 the price is at $1.89, at 08:45 the price drops to $1.74, at 08:46 the price is $1.78, at 08:48 it is $1.80, at 08:50 it again drops to $1.70, at 08:55 it’s $1.72, at 08:59 it is $1.70, and at 09:02 it’s at $1.66. So, this has been the movement of the price for about an hour. And, for the price action traders, this is all they require to analyze what the market is doing.
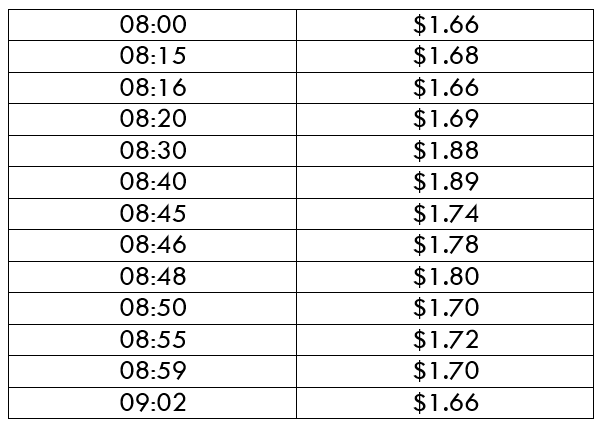
Now, to understand this better, let us take the values above and put it in the form of a line chart.
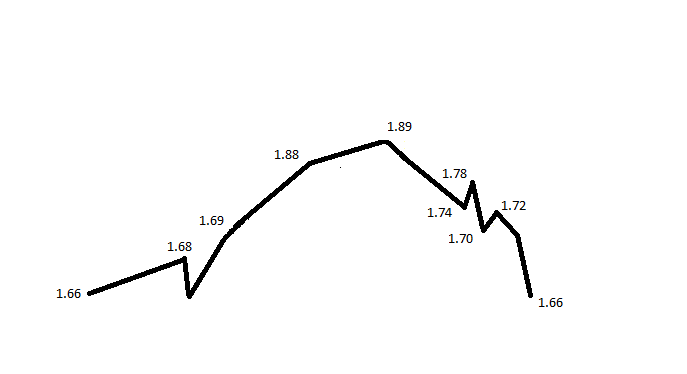
Now, we have three types of people with a different perspective. The first kind of people read it like the way we just did. They observed that there was someone who started buying it at 1.66 and bought it until the price reached 1.89. Once the price reached 1.89, they stopped buying. Later, the price dropped back to 1.66 again. And, now they are waiting to see if the buyer who bought it at 1.66 will buy it again or not. So, the first kinds of people are on standby. Now, the second kinds of people are the ones who only see the current move that has happened. Hence, they look to sell as they see the downward movement coming. And, the third kinds of people are the pattern traders.
According to them, the price went up and came back down. Hence, they think it’s a spike, and they prepare to sell as well. From this, we infer that only the first kinds of people are the ones who have actually understood the market and are in the right direction. Also, they don’t even have charts with them. Therefore, it is vital to feel the rhythm of the market.
Understanding the rhythm of the market
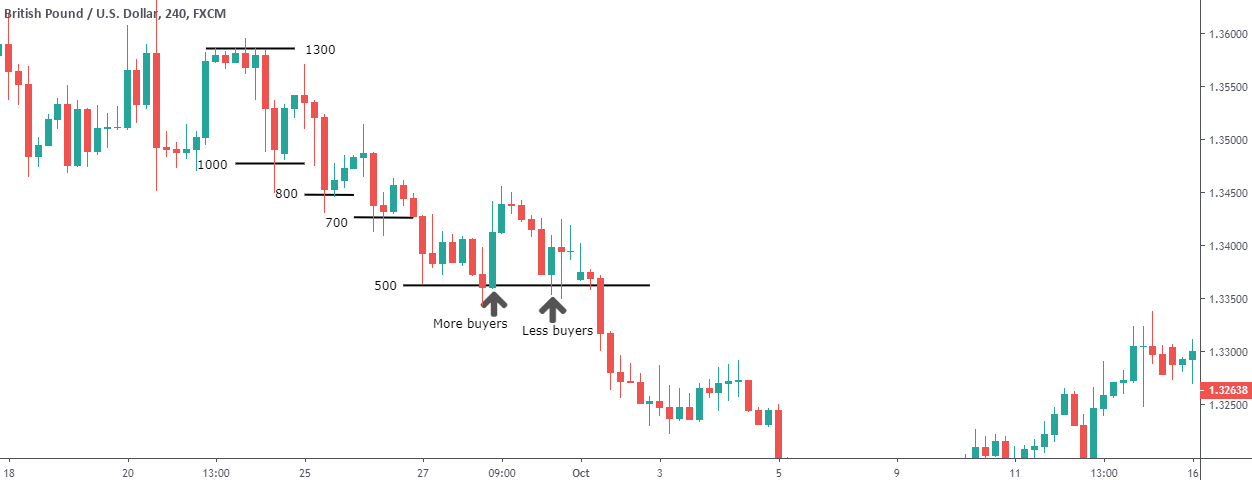
Rather than reading the market technically, let us read it a unique way. For a moment, forget that it is a chart of GBP/USD. Assume that there is a large seller who is willing to sell a product (for example, a laptop). The seller has a large number of laptops to sell, so he wants to sell it at a high price so that he makes a good amount of profit.
Initially, he keeps the price of the laptop at $1300. He observes that nobody is buying at that price, so he gives a discount of $300. He sees some buyers buy it at $1000. But, as there are not as many buyers to fulfil large quantity, he reduces the price to $800. Again, very few buyers buy it as this price.
The seller now has no choice but to reduce the price even lower, so the prices it $700. But, yet again, very few people buy it. So, he drops it to $500 and observes that there are quite a lot of buyers interested to buy at $500. But, he also notes that people stop buying once the price reaches $700. So, the seller again prices it to $500 as he saw a lot of people buying it the last time at this price. But, he notes that there are not enough buyers as there was last time. Now, the seller is forced to drop the price and give more discounts as nobody is willing to buy at that price.
This is the moment we start to think technically. Now that we have all the knowledge of the seller, we can anticipate that the market is going to drop while the whole world is in a thought that the support is holding and the prices might go up.
Bottom line
Taking away the indicator does not turn a trader into a Price Action trader. Understanding the rhythm of the market is what makes a real Price Action trader. A Price Action trader is the one who can trade even without the charts. The movement of the price is sufficient to gauge the market. Hence, this gives an edge to the Price Action traders over other types of traders out there.