
Introduction
There are several definitions/meanings for a candlestick out there. Candlesticks can mean different to different types of traders. A trader who trades using indicators can mean one thing to them, while something else for a Price Action trader. Here, in the following explanation, we will discuss how a Price Action trader analyses the candlesticks.
A quick history of candlestick
Candlestick was actually created by a rice trader in Japan many years ago. Back in the day, there was no concept of different timeframes and stuff. All the rice trader had is one candle that represents the history of the previous day. It would determine at what point (price) the market opened, what was the highest traded price and the lowest traded price and at what price did the market close at. All of this was interpreted by the rice trader. As years passed by and technology advanced, it was implemented on all types of markets with the availability of different timeframes as well.
Basic concept on Candlesticks
A candlestick is a tool that represents the open, close, high, and low in one candle. An example is as given below.
In the candlestick representation given below, the candle opens at “open,” and closes at “close.” A candlestick also has wicks. The top wick represents that the price went to the highest point but didn’t hold at that level and came back down. Similarly, the bottom wick represents that the price went lower than the open price but didn’t hold down there and came back up.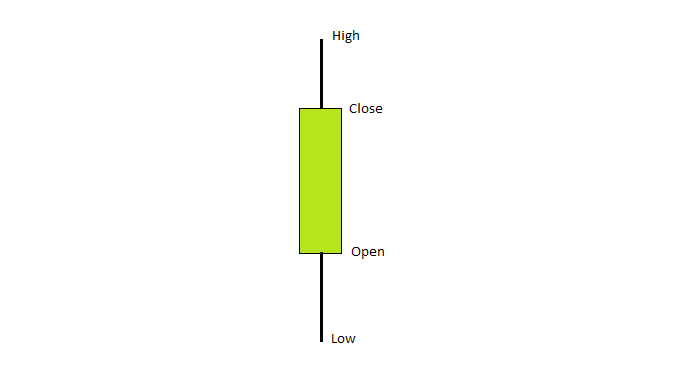
Understanding candlesticks using Price Action
As said previously, a Price Action trader reads the candlesticks in a little different way, unlike other technical traders. A candlestick means a pattern to most of the public. For them, it represents a formula such as A+B=C. Unfortunately, it doesn’t work that way. For a Price Action trader, a candlestick is a receipt on what happened in the market. Do note that a candlestick is not a pattern but is actually a story within it. Therefore, a candlestick is made to understand the story within rather than just labelling it with different names.
The following are some examples of how one must read a candlestick
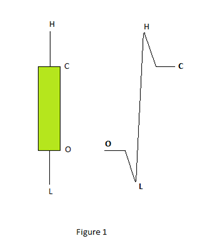
Figure 1: The candle opened at the point marked ‘O,’ dropped to the lowest point ‘L,’ moved up to the highest point ‘H’ and then closed at ‘C.’ What do we infer from this? It means that we are in a buyer’s market, or buyers are currently in control of the market.
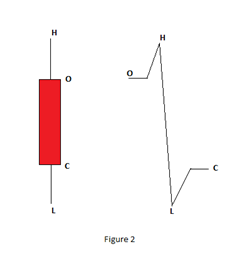
Figure 2: Here, the market opened at ‘O,’ hit the highest point ‘H,’ dropped down to the lowest point ‘L’ and then closed at ‘C.’ Therefore, we can infer that we clearly are in the seller’s territory or the sellers are currently under control of the market.
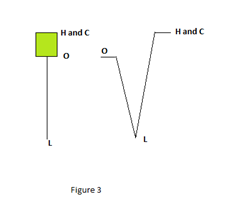
Figure 3: Commonly called a Doji in the industry. It is taught that a Doji represents a reversal in the market. Let us answer the “why” to it. In the corresponding diagram of the candlestick, it represents that market opened at ‘O,’ went lower to ‘L’ and shot back up to the high point ‘H’ and closed at the same high price. From this, we infer that there is pressure in the market and the buyers are not letting the price hold lower. Hence, indicating a buy signal.
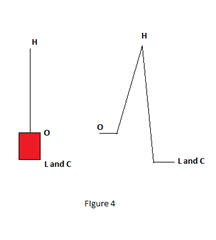
Figure 4: Opposite to the above example, the market opens at ‘O,’ goes to the high point ‘H’ and then quickly drops back down to the lowest point ‘L’ and closes at the same price. This represents pressure towards the downside in the market. Hence, indicating a sell signal.
Timeframes in candlesticks
One of the most critical aspects of candlesticks is dealing with different timeframes. Understanding how candles look in different timeframes is essential in Price Action analysis. Going forward, we will discuss how to read candlesticks in different timeframes.
Example of the formation of candles in different timeframes
Assume that we are working with the 15mins and the 1Hour timeframes. In the 15mins timeframe, it takes 15 minutes to form one candle. And on the other hand, in a 1Hour timeframe, it takes 1 hour for the formation of one candle. Imagine one candle in the 1-hour timeframe. That same 1-hour candle would be represented by four 15 minutes candles (15mins*4 candles=60mins (1Hour)) in the 15min timeframe. Similarly, in a 4H and 1H timeframe, it takes four 1H candles for the formation of one 4H candle.
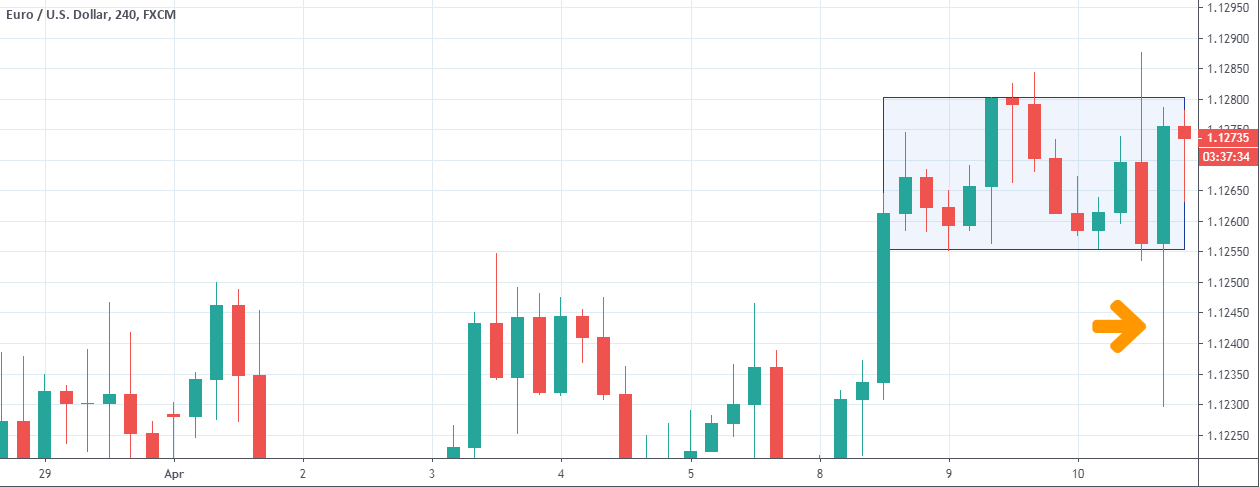
Example:
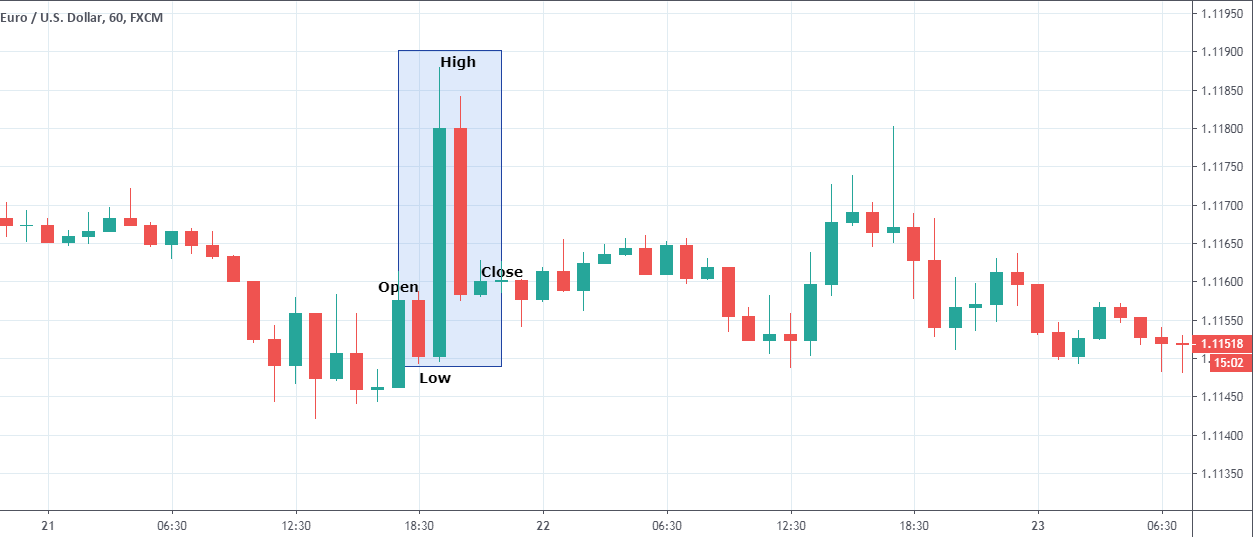
This is an example of Eur/Usd in the 60min timeframe. In the blue transparent box, there are four candles which we will try analyzing how it would look in the 4-hour timeframe. We can see that the opening candle is red and then a huge green bar comes in followed by a red candle and finally, a small green candle. The open, low, high, and close are shown above. If we try imagining all these four candles in one candle, we would be having a small wick on the bottom and a large wick on the top. Also, as the candle closes higher than the opening price, we can say that the candle would be green in color.
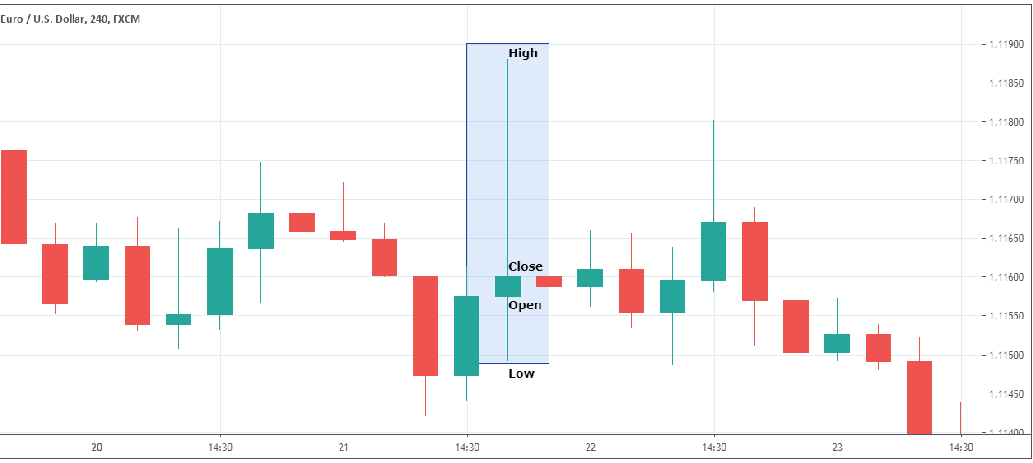
Representation of the candle in the 4 Hour timeframe is given below:
Why are timeframes important in a candlestick?
Having an image of the higher timeframe while trading in a lower timeframe is very beneficial. The candlestick pattern might mean one thing in the lower timeframe and something else in the higher timeframe. As most of the time, the market moves in the direction of the higher timeframe; it is vital to keep an eye on the higher timeframe view. An example supporting the statement is given below.
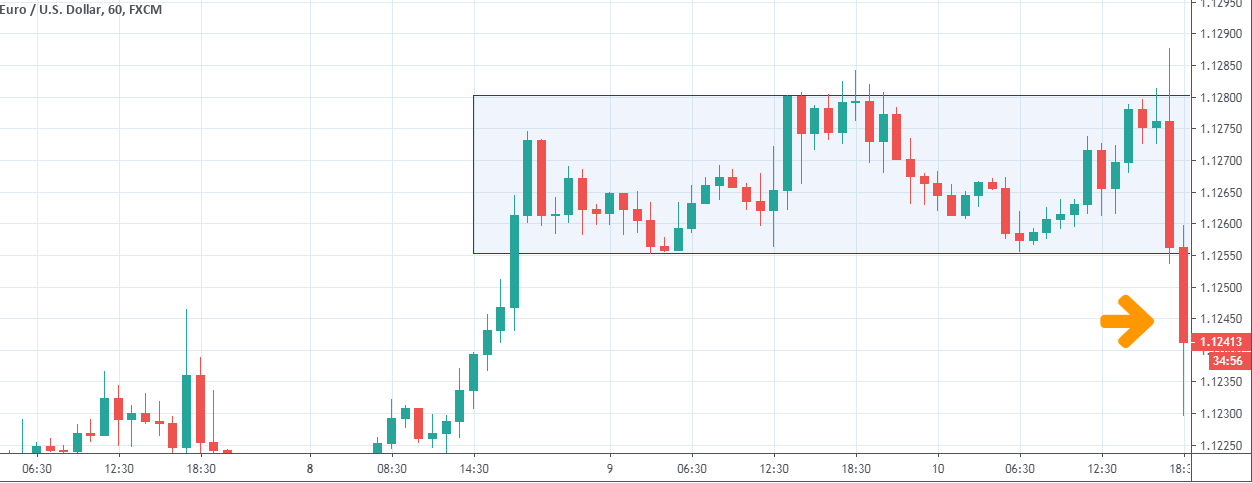
Above is the chart of Eur/Usd in the 60mins timeframe. We can see that the market is in a range (blue box) and as the price drops drastically and breaks the range, most of the public jumps on the sells ignoring the higher timeframe picture.
We saw that most of the range breakout traders jump onto the sells as the range breaks to the downside without an understanding of the higher timeframe. Above is the chart of the higher timeframe (4H). It is clear from the picture that, in the higher timeframe, it is just a wick. As mentioned previously, wick on the bottom represents there is pressure towards the upside. Therefore, all range-breakout traders are wrong-footed. Hence, understanding candlesticks in different timeframes is an essential aspect of Price Action trading.