Talking about Price Action, the first concept a trader should grasp when doing market analysis is the notion of Support and Resistance. In this post, we will review how to identify some types of support and resistance and, also, discuss the concept of the breakout.
The Support and Resistance Concept
Probably the support and resistance (S&R) idea could sound rather basic, but its importance is fundamental in technical analysis. Without the S&R concept, the development of any trading analysis method, besides algorithmic ones, couldn’t be possible. Well-known methodologies such as Wyckoff, Fibonacci, Elliott Wave or even Market Profile use the support and resistance level concept.
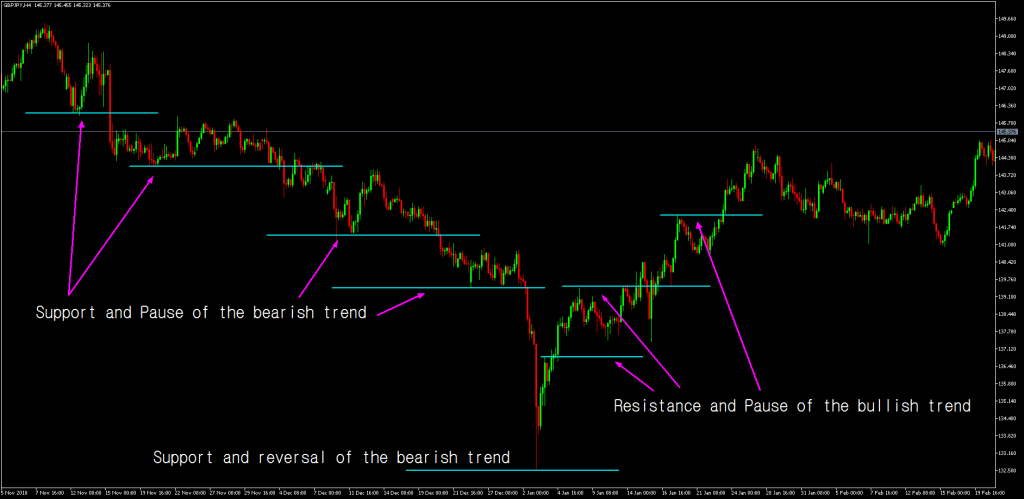
Support is a level at which the price in a downtrend reacts with a bounce off it. That bounce could end up being a pause in the current trend or a reversal move starting a new bullish wave.
Resistance is a level at which the price, moving in an uptrend, reacts creating a retracement. Similarly to the support case, this retracement could result in a pause interval in the current direction or the origin of a new bearish trend.
Chart 1 corresponds to the GBPJPY 4-hour chart. On it, we can observe different supports and resistance levels. At each traced support or resistance, the price made a bounce or a retracement. A typical case when the price approaches an area of support or resistance is to react creating a pause in the price movement and then, resuming the previous trend.
For an enlarged view, please click on the charts.
Key Levels Identification
A Key Level, as its name indicates, is a point in which the price made a significative movement. This move can be a pause or a reversal of the trend. The traditional technical analysis says: “when the support (or resistance) is broken, it becomes in resistance (or support).” Key levels are an important support and resistance levels with a high probability of a reversal in the price action.
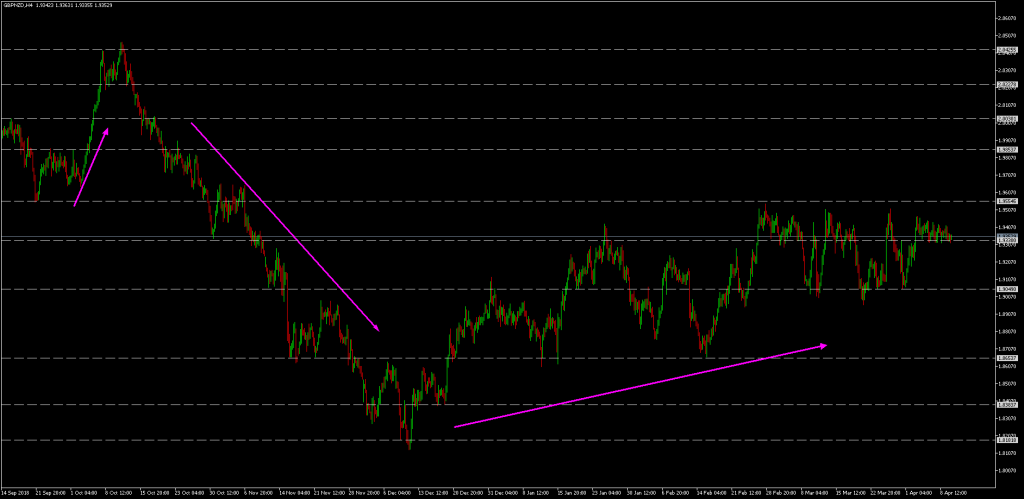
Let’s consider the case of the GBP/NZD 4-hour chart.
As can be viewed in chart 2, we have identified several levels at which the price reacted as support or resistance (dotted grey lines). The way the price progresses, surpassing a level, or bounces, rejecting it can change it into an essential level or an insignificant glitch. To simplify the analysis process here, we have drawn all levels, independently of its relevance.
Round Numbers Levels
It’s a typical human trait to confer importance to round values when we talk about time, money, or any other activity that involves numbers. For example, if a certain price is $14.98, it’s common to round it to $14 (old merchant’s trick to charge an extra buck), or, less commonly, $15. The financial markets are not an exception.
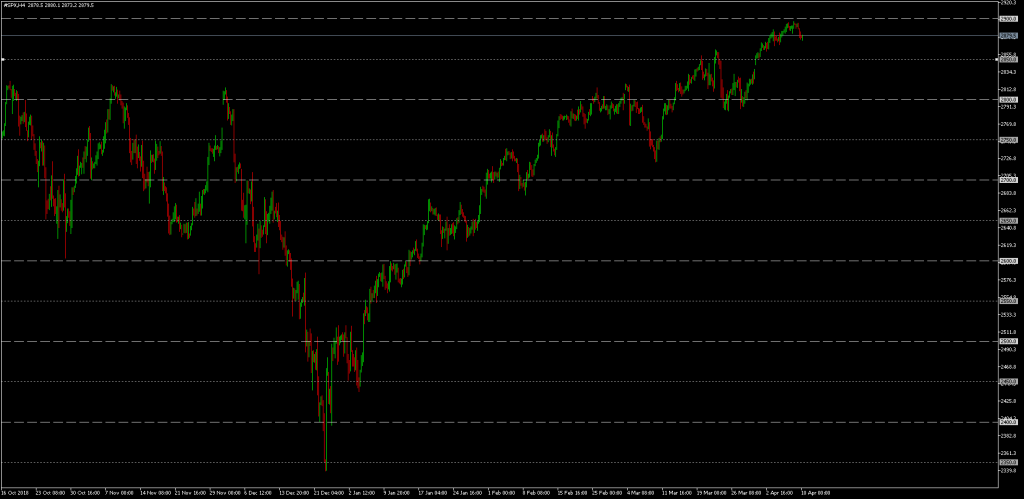
To sharpen our perception about round numbers, let’s pay attention to the Dow Jones Industrial Average when it reached the 25,000 points, or to the S&P 500 when it touched the 2,550 pts and then the 2,900 points. Most traders are stalking these round numbers to make trading decisions around them. Therefore, it is highly likely that these levels depict price reactions like supports and resistances do.
On chart 3, we can observe how the price behaves when it touches a round level. For illustration purposes, we are using here a 50 pts step; that is 2,500, 2,550, 2,600, and so on.
Pivot Points
Pivot Points are a mathematical calculation method that is computed using pre-determined periods. For example hourly, daily, weekly or monthly. Considering this post purposes, we use only the standard calculation. The traditional calculation formula uses the High (H), Low (L) and Close (C) prices of the preceding period as follows:
PP=(H+L+C)/3
Different supports and resistance levels are determined as follows:
- First support S1 = 2*PP - H
- First resistance R1 = 2*PP - L
- Second support S2 = PP - (R1 - S1)
- Second resistance R2 = PP + (R1-S1)
- Third support S3 = R1 + (H - L)
- Third resistance R3 = S1 - (H - L)
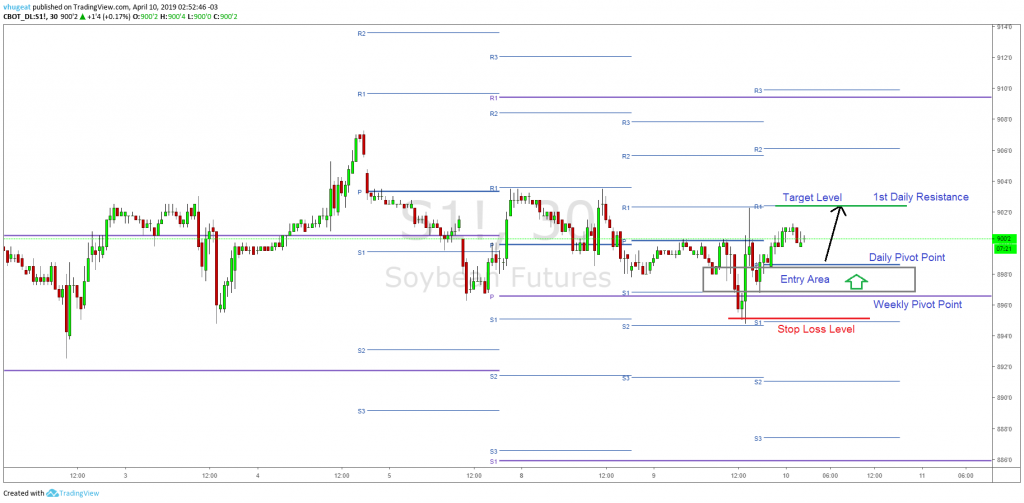
Now that we know how to calculate each pivot level, we will apply in two ways using as an example the chart 4, which corresponds to the Soybean 30 minutes chart:
Chart 4
- First, we can use the Pivot Point to define the bias of the market. As shown in the Soybean chart, the market bias looks bullish, because we see the price above the Weekly and Daily Pivot Point. This observation could be simple, but it saves time in our market analysis.
- Then, we use the Pivot Points as our anchors to develop a trading plan:
- We take long positions when the price moves above PP, and short positions if it is below it.
- First target: R1, second target: R2. If price gains momentum, consider R3 as a final target. In our example, the potential trade is to take a long position from the daily pivot point, with a profit target set at the first daily resistance.
- The stop-loss order should be placed below the low of the Pivot Point. In our example, the stop loss is below the weekly pivot point.
The breakout is a powerful concept which can boost a simple trading strategy. In simple words, a breakout is when the price exceeds (or drops) with “decision” a significant resistance (or support). When we say “decision”, it means the movement is strong. The caveat is that we must have a breakout confirmation. Confirmation is necessary because it is fairly common to experience failed breakouts or fakeouts.
When the price breaks under support, this movement is called breakdown, and its retracement a pullback. Conversely, when the price soars above resistance, it’s called a breakout and a retracement off it a throwback.
Chart 5 corresponds to the GBPCHF cross. In the chart, we observe different cases of breakouts and fakeouts. Pay attention to the fakeouts, it happened two times before the change of the trend. Additionally, please, watch when the breakout or the breakdown happens. In both cases, the movement occurred with a strength.
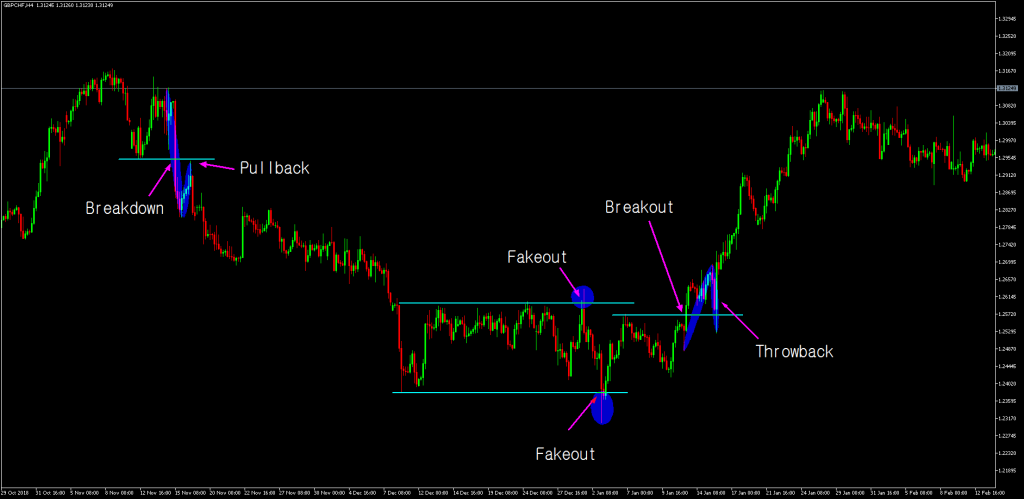
Chart 5
Summarizing and Integrating Concepts
Now that we have explained the Support, Resistance and Breakout concepts it is time to blend and make them work. We should decide which kind of S&R make us feel more comfortable with, according to our personality. All support and resistance analysis is valid as long as it gives us an advantage against the market. Nevertheless, when we detect a breakout, it is important not to pursue the price. We should stalk and wait for the pullback or throwback before pulling the trigger. And finally, we have to consider at which level the trade becomes invalidated and, also, which is the optimal level to place our profit-taking order.




[…] The second step is to identify the price bias. Once detected the first impulsive move, after a breakout or breakdown, it is time to stalk the price action to spot the right place to enter in this new […]