
Introduction
Usually, there are three directions of the market – upward direction, downward direction, and sideways. Identifying the direction of the market might seem very simple, yet it is not understood by many traders. Although there are only three directions, 95% of the people get stuck in the wrong direction most of the times. Therefore, from the statistics, we can clearly say that this topic is taken lightly by the people.
Prerequisites
The concept of timeframes
Traders often deal with different timeframes for their technical analysis. However, many novice traders switch timeframes without understanding the logic behind it. An example to comprehend timeframes is given as follows.
Let’s assume we are working with a 4H timeframe. In a 4H timeframe chart, each candle changes every four hours. Similarly, if we switch to the 1H timeframe chart, it takes one hour for each candle to be formed. Now, as we will be working with multiple timeframes, you must know how many candles makeup one candle. For example, each 4H candle is made up of four 1H candles. Likewise, each Daily candle is made up of six 4H candles and twenty-four 1H candles. When trading, it is always necessary to have a clear picture of the higher timeframe and the lower timeframe. More details on multiple timeframes shall be discussed in the upcoming topics.
Also, before going forward with the actual topic, it is recommended to read the article on “Buyers and Sellers” as it acts as a foundation for this article.
How does a transaction happen?
Trading is very similar to real life business; the only difference, trading in the market involves emotions and psychology as well. Unfortunately, most traders don’t apply that logic here instead are simply trading based on patterns. Well, patterns do work sometimes, but, knowing when it works and when it doesn’t is vital.
So, for a trade to occur one buyer must buy from a seller or a seller must sell to the buyer. This is what happens in the market as well. The better you understand its meaning, the better will be your consistency in trading.
Consider the following example
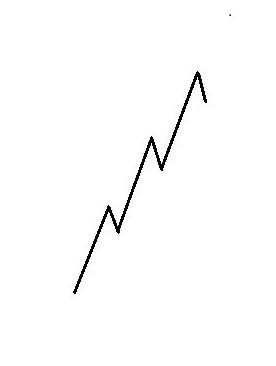
Here, the market is clearly in an uptrend. Imagine this is a currency pair, and the large investors are willing to buy it. They start buying from the bottom, and the price goes up. They add more positions, and the price goes up higher. Now, the public can distinctly see that the price is going up. Hence, they start buying as well. Now, the question that needs to be answered is, if both, the big investors and the general public are buying, who is selling it to them? We know that, for a trade to happen, either the buyer must buy it from the seller, or the seller must sell it to the buyer. But, in this case, as the price goes up higher and higher, there is nobody willing to sell it. Everyone is a buyer.
Similarly, when the big traders and investors want to get rid of their buy position, they need to sell it. This results in the price to go lower. This entices the retail traders to close their positions as well. And, some of them even take short positions. In this whole scenario, there are no buyers in the market. In other words, there are no buyers whom the big seller can sell it to. Therefore, there is a necessity of both the parties (buyer and seller) for a trade to take place.
So, what happens next?
When the other party starts to fade away, the big traders and investors either stop buying/selling at that moment or close their positions. For example, if the big players are buying, and they observe that there are no sellers to sell it to them; they either close some of their buy positions or hold on to their positions. This results in the price to come down. As the price comes down lower and lower, the public who was buying is now out of the trade as their stop loss is hit. Also, some traders see it as a down trending market, and they begin to take short positions. Now, there are sellers in the market. This is when the big player (who is a buyer) steps in and buys it from the sellers (public). Hence, this how the market works.
A complete trade example
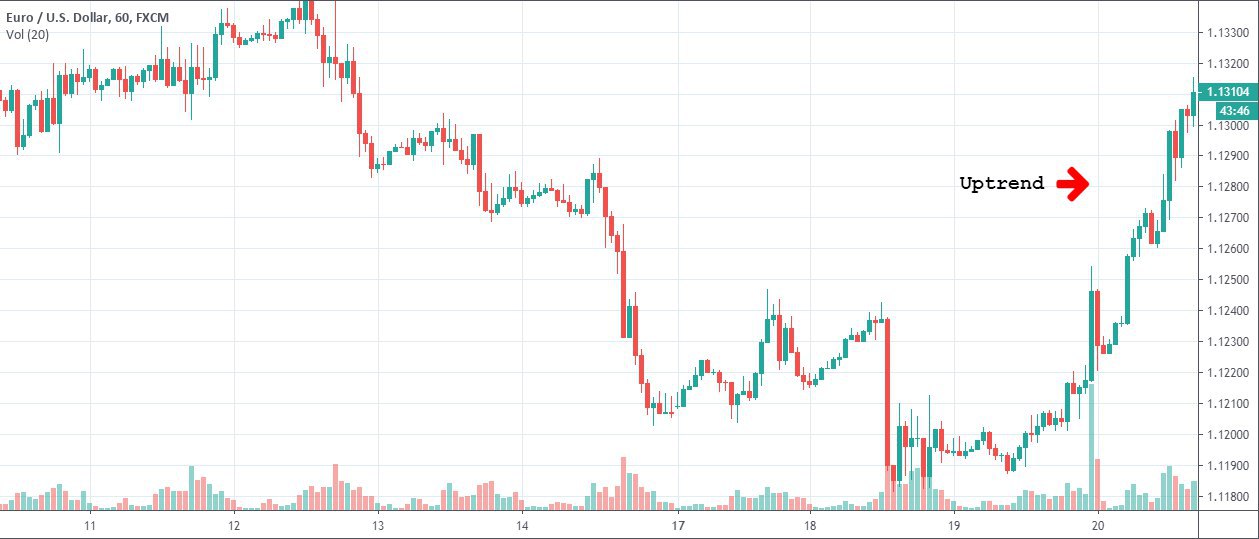
Since the big players move the market, we need to know their direction. This is where the concept of multiple timeframes comes into action. To determine if the big players are buying or selling, we need to determine the trend in the higher timeframe. In the below example, let us consider 1H to be the higher timeframe and 15mins as the lower timeframe. From the 1H timeframe chart, we can observe that the market is an uptrend. In other terms, the big player is a buyer. After determining the direction of the big player, we then switch to the lower timeframe, which is the 15mins. Now, as the price keeps going up, the public jumps in on the buy as well. At this point, nobody is selling in the market.
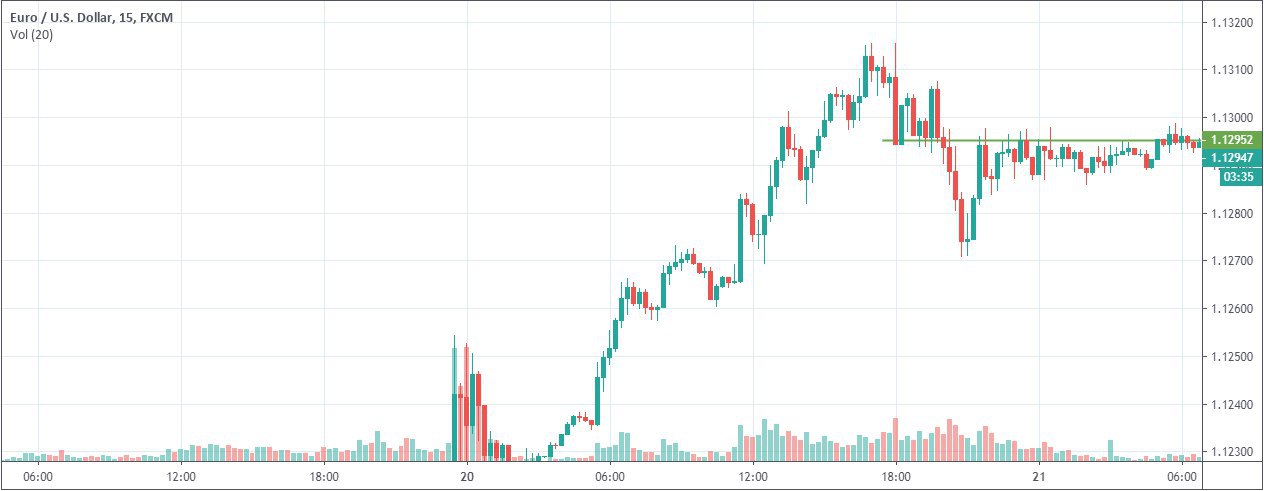
As previously discussed, when there are no sellers in the market, the big players get rid of some of their positions, which results in the prices to come lower. Let us analyze what the retail traders are going through. When the price comes to the green line (support), people see that the support is holding and then they start to add more buy positions. And, when the price breaks the support, people’s stop loss is hit. Also, as the price comes back to the support and resistance line, people look at it as a sell. This brings sellers into the market. And, this is when the buyers (big players) come in and eventually lift the market.
The result of the trade is as shown below.
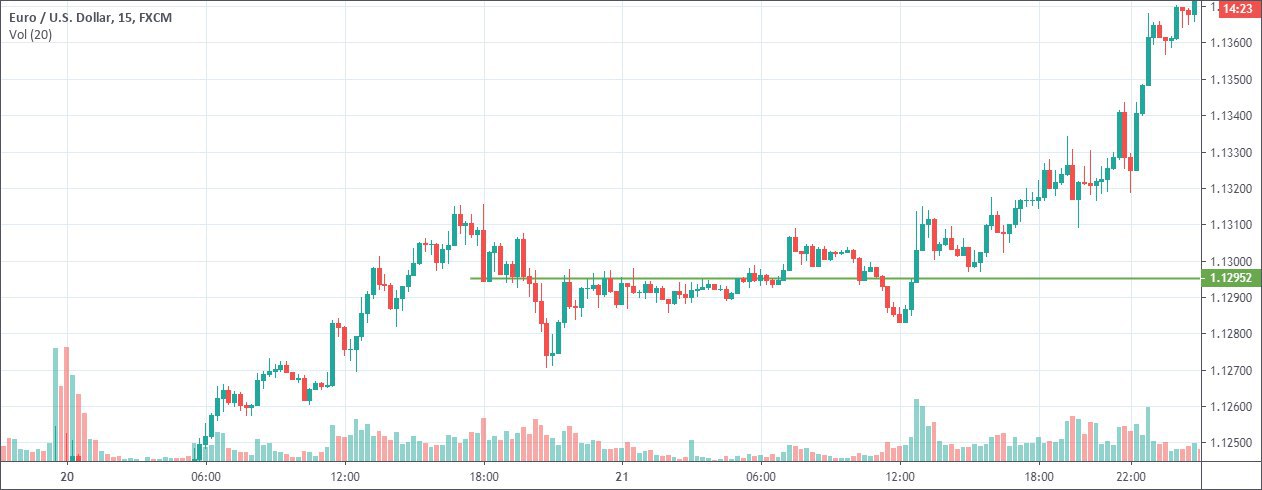
Therefore, the public gets into the wrong direction yet again, and the big players resume their uptrend.
Conclusion
So, what do we infer from the above trade? One set of traders look at it as a sell, while the smart traders are desperate to pump their money for the buy. As the large players have a lot of their orders to be filled, they turn the public into a seller, so that they can buy it from them and complete their transaction without any hassle. Well, the concept is simple. If there are more sellers in the market, it becomes easier for the large players to fill their orders, and move the market more smoothly and swiftly. Therefore, it is vital to understand the direction of big participants. In technical terms, having a visualization of the higher timeframe is highly recommended as they are the ones who set the trend of the market.