What is a Candlestick?
Let us quickly understand what a candlestick is before getting into in-depth discussions about it. To the majority of the public candlestick is a pattern. Technically, yes, it is a pattern, but the pattern has a story within it. Understanding the story makes the pattern more valuable. In other words, it is a receipt of what happened in the market. Analyzing the history, the future can be predicted. Well, so this is a candlestick and its use.
Candlestick Patterns
There are a countless number of candlestick patterns out there on the internet and the books. However, there is a misconception in the industry. People think that if they study all the patterns on candlesticks, they can sustain in this industry. Unfortunately, this is not how it works. The only way to trade candlestick patterns is to understand what it actually means. Forget the terminology and focus on the “why.” The candlestick patterns seem to work exceptionally well sometimes, and miserably fail most of the time. Therefore, knowing when it works and when it doesn’t, work is important. So, let us go ahead and answer the above question.
The Best Candlestick pattern for a Price Action Trader
The most liked candlestick pattern for a Price Action trader is the so-called exhaustion candle. It is also referred to as a hammer, inverted hammer, etc. However, as mentioned above, forget the terminology and focus on what it means to you. Going forward, we will discuss on how to read this candlestick pattern and trade using it.
How does exhaustion candle look like and how to interpret it?
Below is the representation of an exhaustion candle
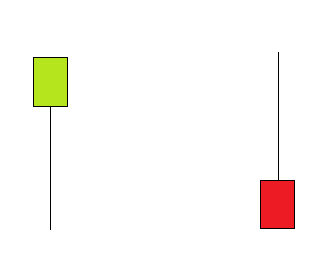
Interpretation
It is taught everywhere that, when an exhaustion candle occurs with a wick on the bottom, the market will head north. And, if the wick appears on the top, the market will head south. Well, the reason for it is not taught.
Consider the below example.
The above image represents an exhaustion candle and its corresponding line representation. Focusing on the line representation, the price opens at the point marked O and then it drops below and jumps right back up. The price does not even hold at the Support and Resistance (Blue line), signifying that the buyers are quite strong and the sellers do not seem to be interested in selling. Hence, indicating a buy signal.
Similarly, in the image above, the price opens at “O,” goes up and gets smacked back down. Also, the price does not hold at the S&R line (Blue line), which implies that the sellers are strong and not letting the buyers hold at S&R. There are several ways of interpreting it; however, having knowledge of one way of interpretation is sufficient.
How to trade using the exhaustion candle?
Knowing what it means is insufficient to take trading decisions. Having an understanding of the context plays an important role as well. The story before an exhaustion candle appears is very crucial. This is the key which tells when an exhaustion candle will work and when it will not.
Consider the following examples:
Example 1:
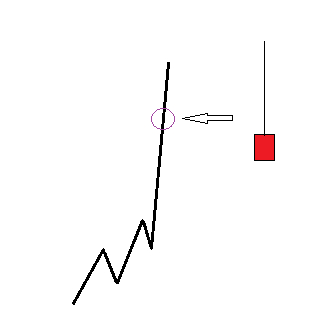
Assume that the market is in an uptrend, as shown in the above figure. Starting from the bottom, the price went up, retraced quite a bit. It went up again and retraced the same as the previous retracement. And, finally, it blasted to the upside. From this, we infer that the buyers are powerful. In the middle of the up move, an exhaustion candle pops up at the circle marked. Now, according to the textbooks, it must be a sell. Well, why does not the sell work? Here is where the context comes into play. The story before the candle appeared clearly says that the buyers are in complete control of the market, and one exhaustion candle is totally insignificant to these strong buyers.
Example 2:
In this example, the market is in an uptrend. However, there is a problem with this uptrend. Observe that this uptrend is not as strong as the previous example uptrend. For every higher high it makes, it is retracing quite a lot (about 50-60%). Also, the higher highs are weakening every step of the way. And then finally it retraces more than 100%. Now, let us examine what this 100% retracement (the circle area) may look in the form of a candle. As represented in the figure, it is an exhaustion candle. The story now signifies that the buyers are fading away and the sellers are picking up pace. Therefore, the exhaustion candle now holds much value.
Inference
There two most important factors to be noted for trading an exhaustion candle are:
1. The location where it appears
2. The strength of the market before the exhaustion candle shows up
These two are the criteria that help in determining if an exhaustion candle will work or not.
The Complete trade explained
In the above figure, the market is in an uptrend where the purple line is the Support and Resistance line. We now wait for a pullback to happen so that we can buy it. Let us read the pullback. In the pullback, we observe five red candles with one green exhaustion candle. In the five red candles, the first one did not do much while the second one was big. The third candle was smaller than the second one, and the fourth candle was again much smaller than the third one. Here, we infer that the sellers are slowly slowing down. The fifth candle comes up with wicks on both sides. This means that the buyers came back, but the sellers did not quite yet. Lastly, an exhaustion candle comes up. Let us verify whether both the criteria mentioned above are satisfied or not. The candle appeared at the Support (buyer’s area); hence, the first criterion is satisfied. Also, the strength of the market before the exhaustion candle appeared seems to be slowing down; therefore, the second criteria is satisfied as well. Hence, now is the time to pull the trigger for a buy. The target can be set to the recent highs, and the stop loss can be kept below the exhaustion candle.
[…] Pattern we are going to try to master has been described here. On that article, it is called Exhaustion Candle and is one pattern of what is termed reversal […]