The financial markets produce so many kinds of patterns, signals for traders every day. Those who are good at spotting those signals and know how to use them in taking entries, without any doubt they do well in terms of making money in trading.
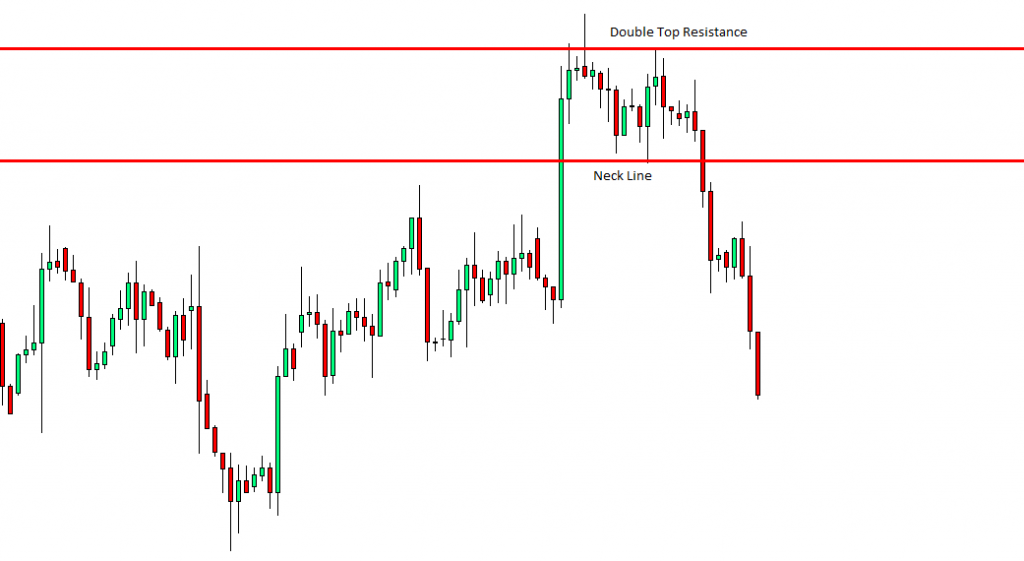
One of the patterns the financial markets often produce is Double Top. It is a shape or a pattern which is produced if the price gets a rejection from the same level of resistance twice. Since the level is held twice by the price, so traders start respecting this level as a level of resistance. Consequently, it attracts the sellers to go short if some equations are obeyed accordingly. We will know what those equations are.
Let us now have a look at an example of Double Top and its consequence.
Double Top Formation
The red line which is marked as the resistance of the Double Top has been held by the price twice. At first, the price had a rejection and came back up to the ‘Neck Line’. Then, the price went upward again and had a rejection from the same level. This time it produced an Engulfing Candle as well. This is where sellers were getting ready to have a breakout right at the Neck line. The breakout is one of the equations which must be met. A breakout candle has to have a thick body with a small wick like the one we have right here.
The Breakout
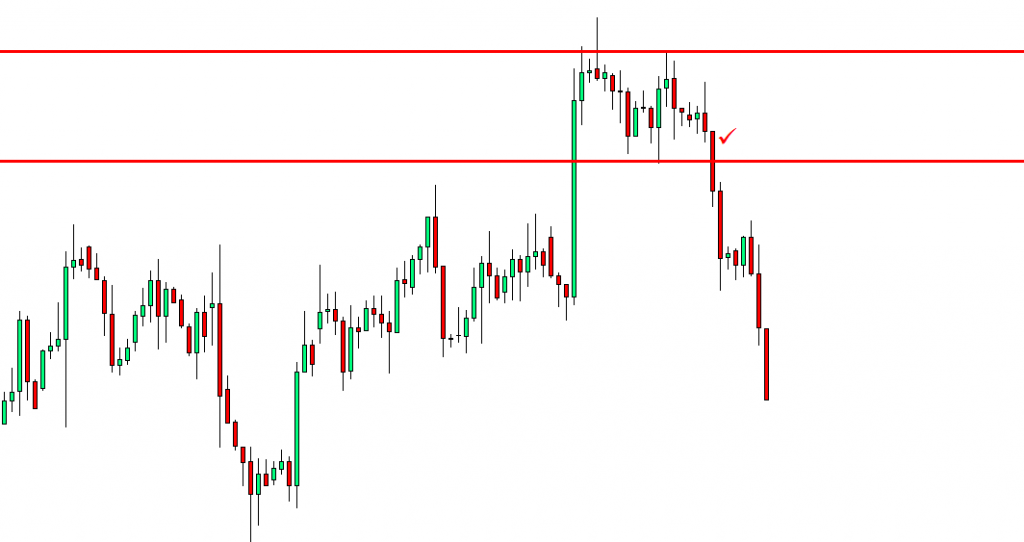
The ticked candle is the breakout candle, which made the breakout with a lot of strength. Once a breakout takes place like this, the price heads towards the South with good selling pressure.
Three Equations for Double Top
Three equations that we need to follow to trade on a Double Top. These are:
- Double Top’s Resistance has to be marked accordingly.
- Double Top’s Neck line has to be marked accordingly.
- The breakout has to take place with a good commanding bearish candle with less wick


You are great sir
Every thing nice explain.
Thanks
Thanks a lot Ramkumar.